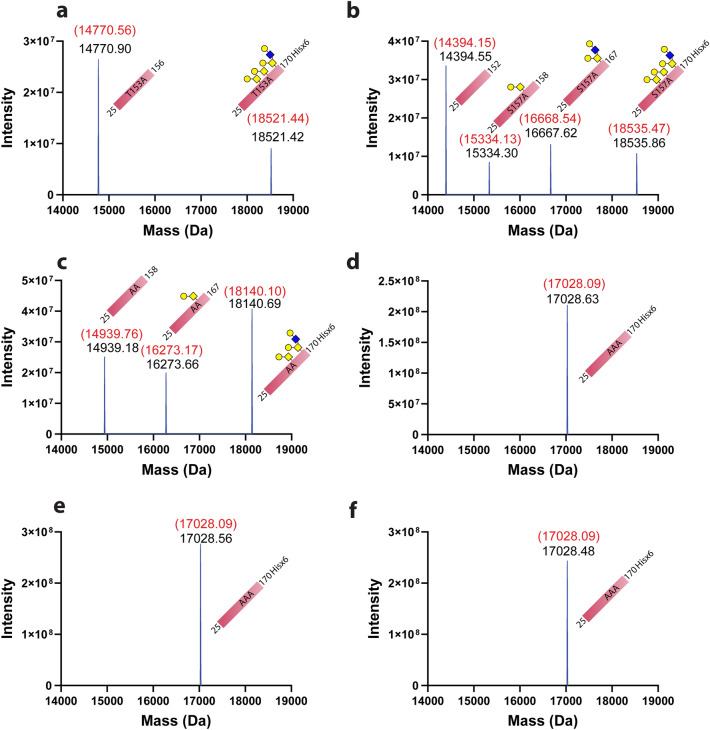
Figure 6.
Intact mass analysis of four alanine mutation PD-1 proteins that were treated with PNGase F, sialidases, and O-protease in combination. (a) PD-1 with T153A mutation, (b) PD-1 with S157A mutation, (c) double mutation of PD-1 at positions T153A and S157A, and (d) triple mutation of PD-1 at positions T153A, S157A, and S159A treated with PNGase F, (e) triple mutation of PD-1 at positions T153A, S157A, and S159A treated with PNGase F and sialidases, and (f) triple mutation of PD-1 at positions T153A, S157A, and S159A treated with PNGase F, sialidases, and O-protease. MW shown in red is based on calculations with modifications, as described in detail in the corresponding text. MW shown in black represents deconvoluted mass from experimental data. Graphs were generated using GraphPad Prism version 9.4.1 for Windows (https://www.graphpad.com/) using original data obtained from Biopharma Finder 3.0, as shown in supplementary Figs. S11–16.

