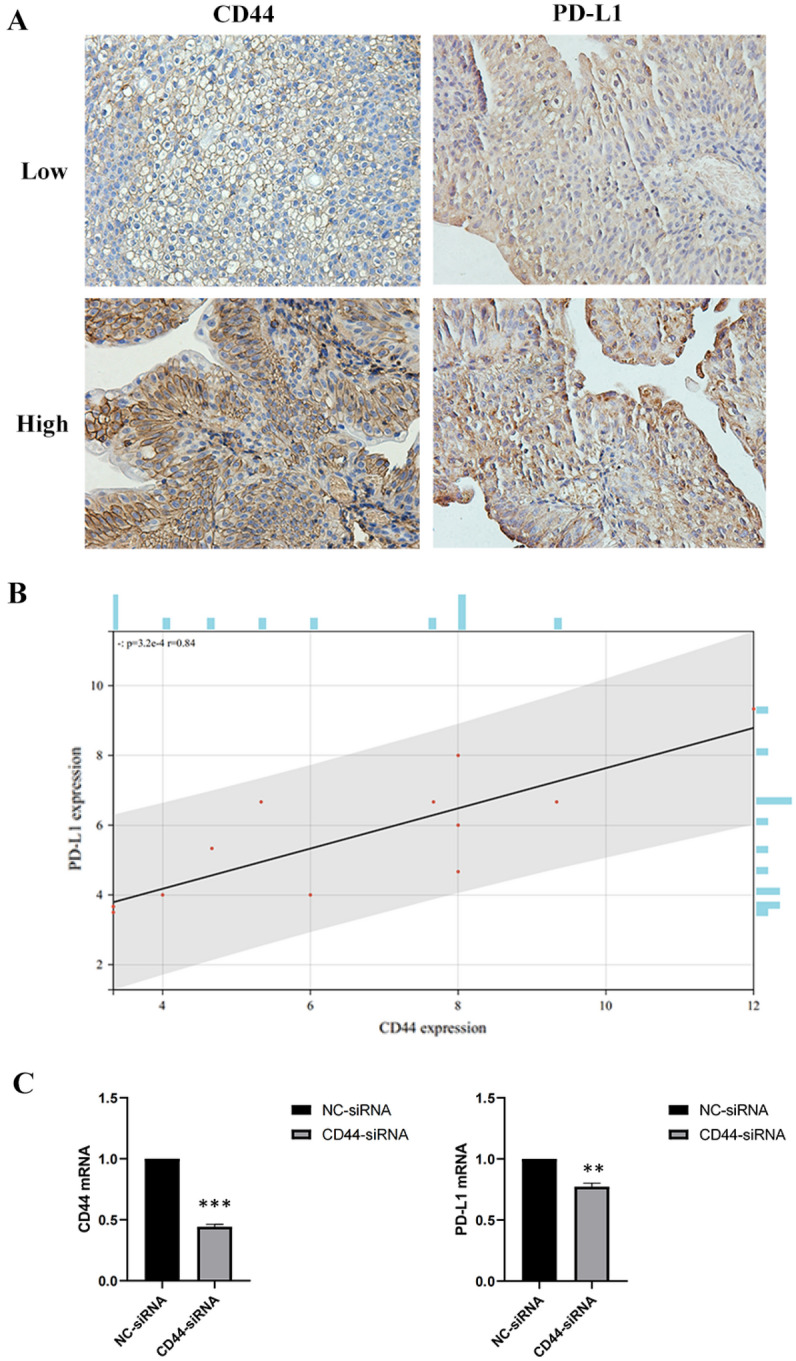
Figure 2.

(A) representative IHC staining of CD44, PD-L1 in BLCA patient tumor sample. Upper: representative patient with high CD44 expression. Lower: representative patient with low CD44 expression. (B) Correlation analysis between the CD44 expression and the PD-L1 expression. Pearson’s correlation coefficient (r) and significance level (P-value) are shown as correlations. (C) 5637 cells were transfected with negative control (NC) siRNA or CD44 siRNA. mRNA levels in the transfected cells were assessed by RT-qPCR analysis.
