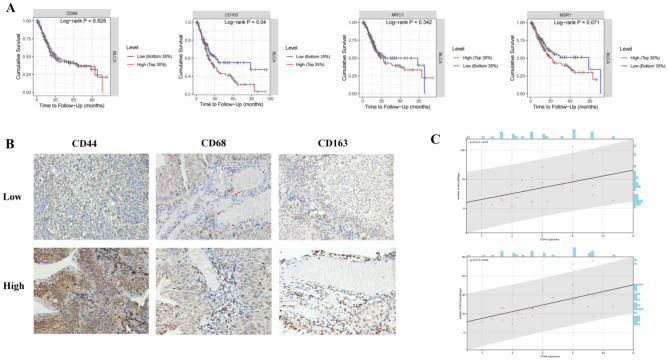
Figure 4.
(A) Correlation between expression of gene markers of macrophage, M2 macrophage and survival of BLCA patients based on data from Kaplan–Meier plotter. (B) Representative IHC staining of CD44, CD68, and CD163 protein in BLCA tumor sample. Upper: representative patient with high CD44 expression. Lower: representative patient with low CD44 expression. (C) Correlation analysis between the percentage of CD44 and the number of macrophages and M2 macrophages per patient. Pearson’s correlation coefficient (r) and significance level (P-value) are shown as correlations.

