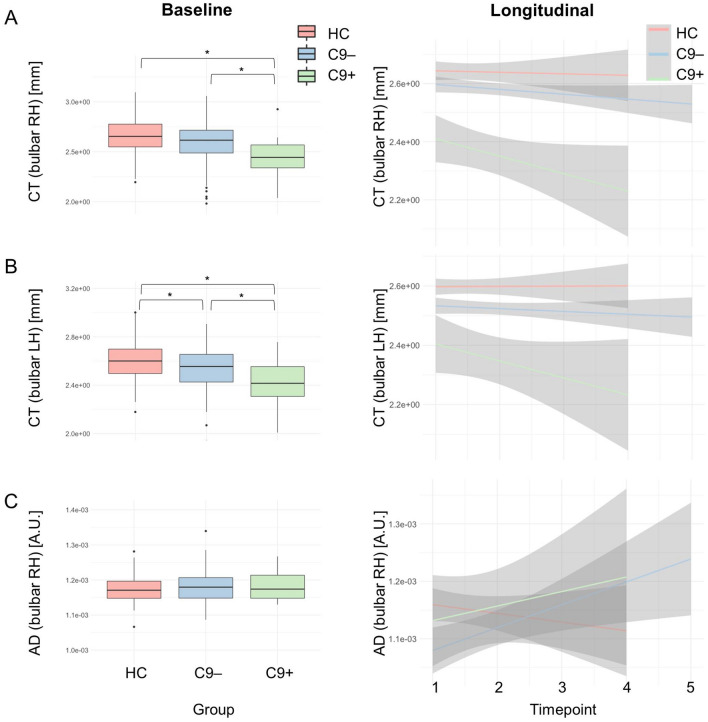
Fig. 4.
Analysis stream 2: the evaluation of bulbar imaging indices in GGGGCC hexanucleotide repeat expansion carriers in C9orf72. Cross-sectional patterns (left panel) and longitudinal changes (right panel) were evaluated at cortical level, in cortico-medullary connectivity and in the brainstem. Detailed descriptive statistics are presented in Table 2. Boxplots represent medians 1 quartile, whiskers denote a data range spanning the median , dots represent outliers, whereby IQR is the interquartile range. * denotes statistical significance of unpaired t-tests, thresholded at p ≤ 0.05. AD axial diffusivity, ALS patients with amyotrophic lateral sclerosis, C9 + ALS patients with GGGGCC hexanucleotide repeat expansion in C9orf72, C9- ALS patients without GGGGCC hexanucleotide repeat expansion in C9orf72, CT cortical thickness, FC functional connectivity, HC Healthy control, IQR interquartile range, RD radial diffusivity

