FIGURE 3.
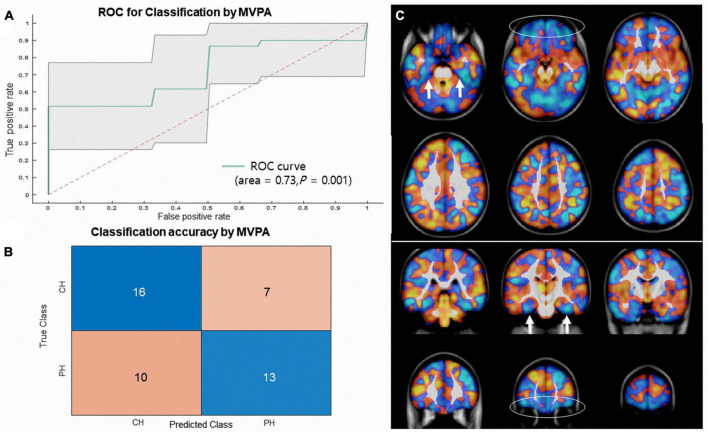
(A) Shows receiver operating characteristic (ROC) curves and (B) shows confusion matrix generated for classification of long COVID headache from primary headache (cyan line, AUC = 0.73, permutation p = 0.001, accuracy = 63.4%; CH class accuracy = 69.5%, PH class accuracy = 56.5%) based on MVPA using SVM. The shaded area represents the 95% confidence interval. (C) Shows a non-thresholded multivariate (SVM) weight map overlaid on a T1-weighted MRI image (raw image available at https://neurovault.org/images/795018/). The colors represent relative positive weight distributions (orange) and negative weight distributions (cyan). Note that the gray matter volume decrease in the orbitofrontal (ellipse) and parahippocampal (arrows) areas classifies long COVID headaches.

