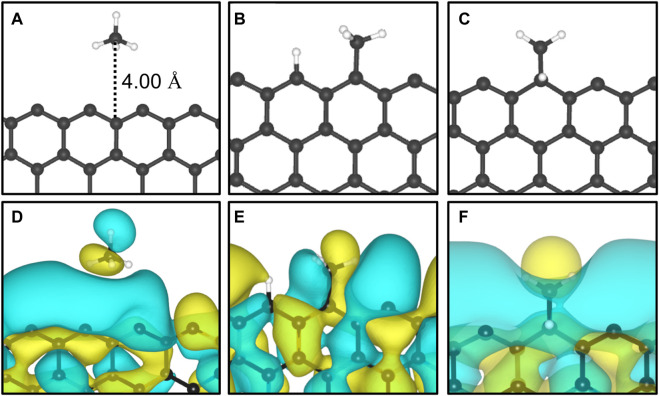
FIGURE 5.
Representation of (A) CH4 adsorbed on the Z2; (B) CH3 and H chemisorbed on different Z1 sites; (C) CH3 and H chemisorbed on the same Z1 site and their HOMO represented in (D, E) and (F), respectively. The yellow and cyan colors represent the positive and negative phases, respectively, of the HOMO. The adopted isosurface cut-off value was 0.01 e Å −3.

