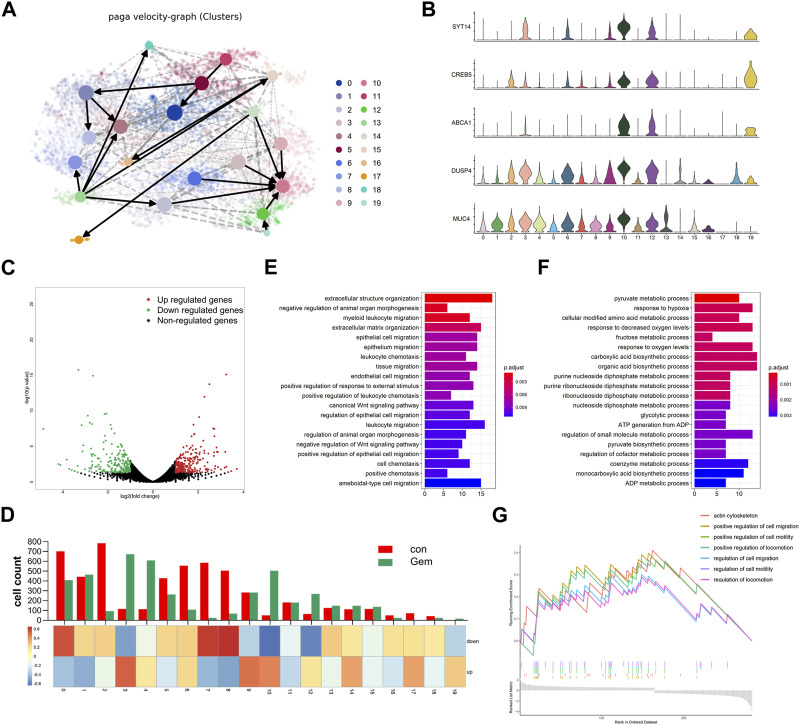
FIGURE 4.
Gemcitabine changed the evolution direction of subclones in tumor cells. (A) Velocity graph superimposed to the t-SNE embedding of cells from the two groups merged. Cells are colored according to cell types. (B) Violin plots showing the high expression of marker genes of clusters 3, 4, 10, 12, and 19. (C) Volcano plot showing the DEGs in bulk RNA-seq data of each group (n = 3). (D) The histogram showing the composition of cells in each subpopulation, and the heatmap showing the DEG enrichment in each subpopulation. Bar plots of KEGG enrichment analysis by the upregulated genes (E) and the downregulated genes (F) of bulk RNA-seq. (G) GSEA indicated significant enrichment of GO pathways in the marker genes of cluster 10.

