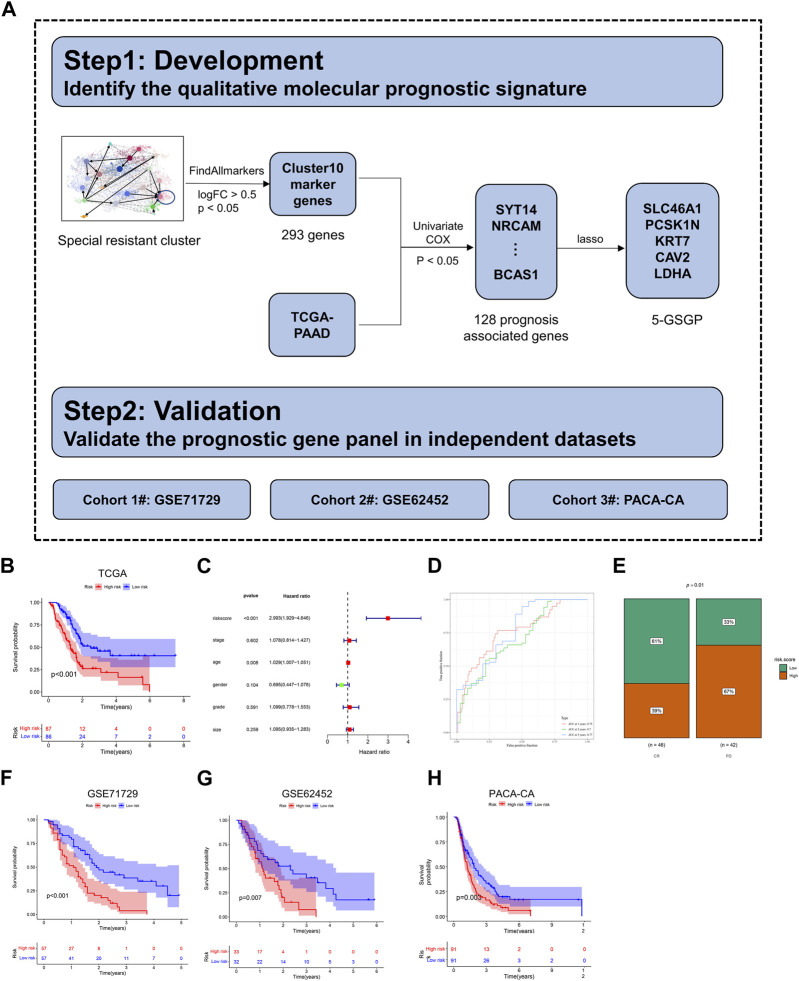
FIGURE 5.
Construction of a diagnostic model. (A) The flowchart for development and validation of the diagnostic model. (B) The K–M curves of OS for the two prognostic groups stratified by the risk score in the training cohort. (C) Univariate Cox regression analysis of clinical characteristics and the risk score. (D) Comparison of time-dependent ROC curves of the risk score for predicting the 1-, 2-, and 3-year OS rates. (E) Hierarchy graph demonstrating TCGA analysis on high- and low-risk scores of PDAC patients with progressive disease (PD) and complete response (CR) after gemcitabine treatment. (F–H) The K–M curves of OS for the two prognostic groups stratified by the risk score in the validation cohorts.

