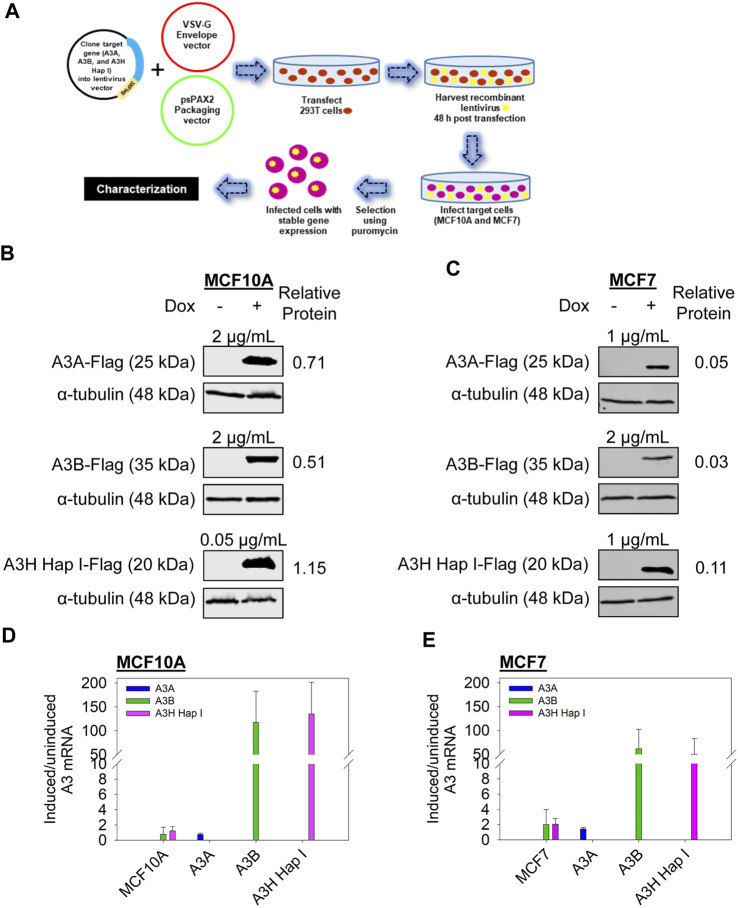
FIGURE 1.
A3 protein and mRNA transcript levels in the stable cell lines. (A) Schematic of the generation of the stable cell lines derived from MCF10A and MCF7 cells. (B and C) Steady-state protein levels of A3A, A3B, and A3H Hap I in MCF10A and MCF7 cells. The cells were either uninduced or dox induced for 72 h, and the protein expression was assessed by immunoblot. To obtain similar protein expression levels, the following dox concentrations were used for each cell line: MCF10A A3A (2 μg/mL dox), MCF10A A3B (2 μg/mL dox), MCF10A A3H Hap I (0.05 μg/mL dox), MCF7 A3A (1 μg/mL dox), MCF7 A3B (2 μg/mL dox), and MCF7 A3H Hap I (1 μg/mL dox). Three biologically independent experiments were conducted. Approximate molecular weight (kDa) of each protein is shown based on the closest molecular weight marker band (Supplementary Figure S3). Bands were quantified from one representative experiment, and the Flag intensity was divided by the α-tubulin intensity to account for potential loading differences. Representative results are shown as relative protein levels. Blots were cropped to improve conciseness of the presentation, and uncropped blots are shown in Supplementary Figure S3. (D, E) The mRNA expression measured by qRT-PCR is shown as the fold change of each A3 for induced compared to uninduced conditions after normalization of each to TBP expression. Error bars indicate the S.D. from the mean for three biologically independent replicates.

