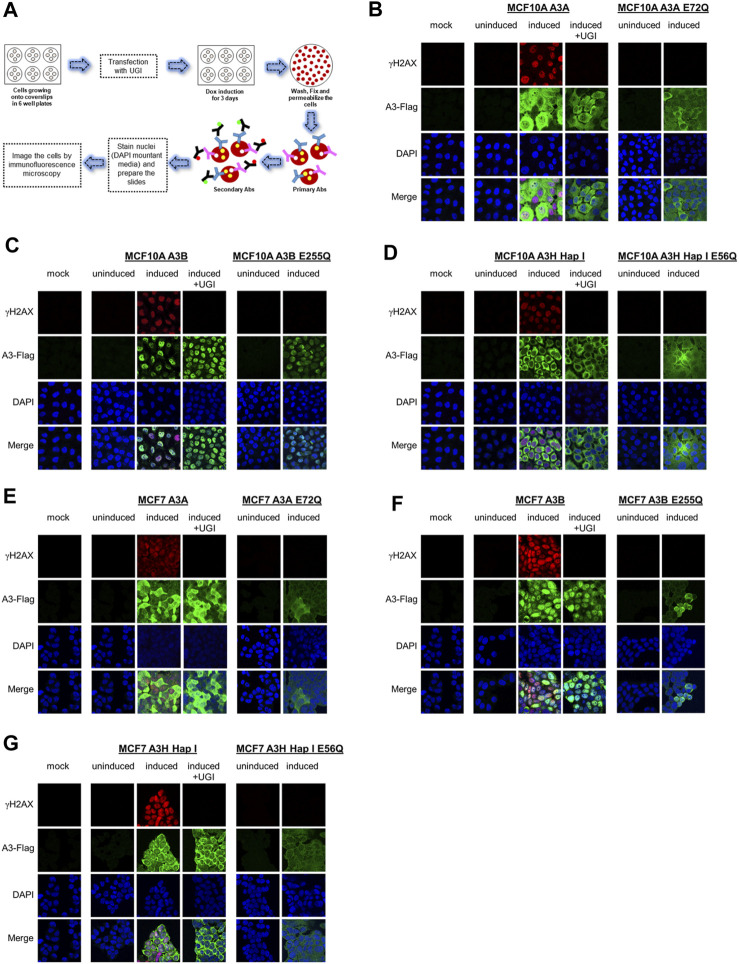
FIGURE 2.
γH2AX foci formation by A3A, A3B, and A3H Hap I. (A) Schematic representation of the protocol followed to assess the protein localization and γH2AX foci formation by immunofluorescence microscopy using antibodies (Abs). (B–D) The MCF10A cell line was not transduced and treated with dox for 72 h (mock), transduced to express A3A, A3B, or A3H Hap I and not treated with dox for 72 h (uninduced), transduced to express A3A, A3B, or A3H Hap I and treated with dox for 72 h (induced) without or with transfection of a UGI expression plasmid (induced + UGI), transiently transduced with catalytic mutants of A3A (E72Q), A3B (E255Q), or A3H Hap I (E56Q) and not treated with dox for 72 h (uninduced), and transiently transduced with catalytic mutants of A3A (E72Q), A3B (E255Q), or A3H Hap I (E56Q) and treated with dox for 72 h (induced). Green identifies Flag-tagged A3 enzymes, red indicates γH2AX foci formation, and blue indicates nuclei staining. (E–G) MCF7 parental cell line and MCF7-derived stable cell lines were subjected to same treatments as for the MCF10A cell lines.

