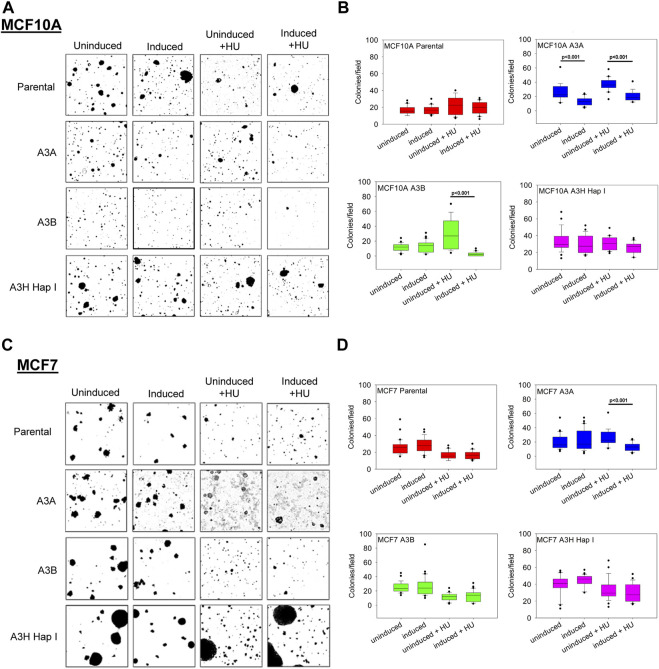
FIGURE 5.
Effect of the expression of A3A, A3B, and A3H Hap I on anchorage-independent growth in soft agar. MCF10A and MCF7 cells were either untreated, treated with dox (0.05–2 μg/mL, 24 h), or treated with dox and HU (2 mM–12 mM, 6 h). After 3 weeks, colonies were imaged and quantified. (A) Representative images of colony formation in uninduced, induced, uninduced + HU, and induced + HU for MCF10A parental, A3A, A3B, and A3H Hap I cells. (B) Box-whisker plot of quantified uninduced, induced, uninduced + HU, and induced + HU MCF10A colonies. (C) Representative images of colony formation in uninduced, induced, uninduced + HU, and induced + HU for MCF7 parental, A3A, A3B, and A3H Hap I cells. (D) Box-whisker plot of quantified uninduced, induced, uninduced + HU, and induced + HU MCF7 colonies. Three biologically independent experiments were conducted. One representative experiment is shown in panels A and C. The statistical differences were determined by a t-test on the biologically independent experiments and considered statistically significant for p < 0.05.

