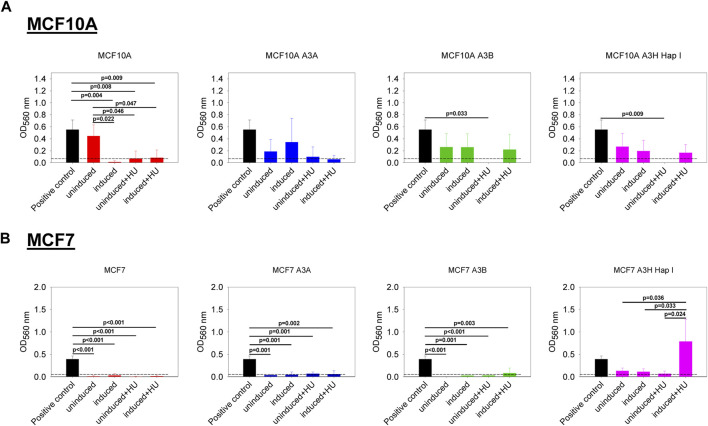
FIGURE 6.
Effect of the expression of A3A, A3B, and A3H Hap I on cell migration. A colorimetric kit based on the Boyden Chamber principle was used to assess transwell migration. The Optical Density (OD) values were measured at 560 nm. The dashed line represents the cut off calculated from the condition without cells. The BC cell line HCC1428 was used as a positive control of migration (Veeraraghavan et al., 2014). (A) MCF10A-derived stable cell lines were either untreated (uninduced) or treated with dox (induced) for 7 days. The cells were also treated (induced + HU) or not (uninduced + HU) with dox for 7 days and twice with HU. (B) MCF7-derived stable cell lines were treated as described for MCF10A-derived stable cell lines. Three biologically independent experiments were conducted, and results are represented using mean values and S.D. The statistical differences between the groups were determined by one-way ANOVA for p < 0.05, and p-values are shown on the graph.

