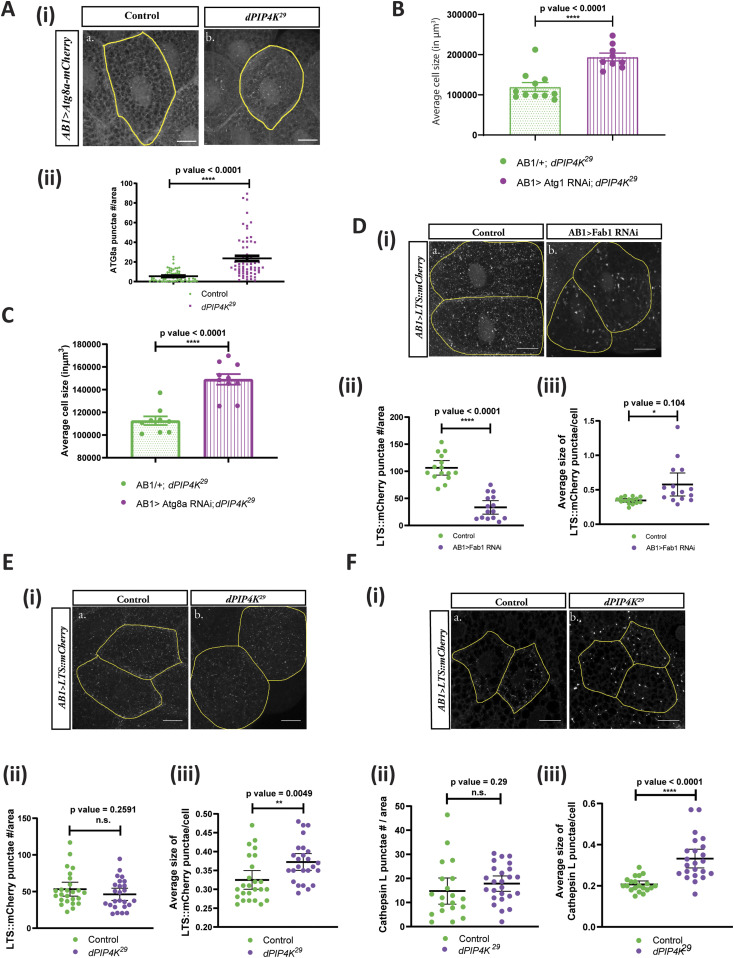
Figure 6. PIP4K affects the auto-lysosomal pathway to affect cell size in Drosophila salivary glands.
(A) (i) Representative confocal z-projections depicting autophagosomal levels using Atg8a-mCherry in the salivary glands from the wandering third instar larvae of AB1>Atg8a::mCherry (Control) and AB1>Atg8a::mCherry; dPIP4K29. Scale bar indicated at 20 μm. (ii) Graph representing Atg8a punctae measurement in the salivary glands from wandering third instar larvae of AB1>Atg8a::mCherry (N = 10, n = 60) and AB1>Atg8a::mCherry; dPIP4K29 (N = 10, n = 62). Unpaired t test with Welch correction showed P-value < 0.0001. (B) Graph representing average cell size measurement (in μm3) as mean ± S.E.M. of salivary glands from wandering third instar larvae of AB1/+; dPIP4K29 (n = 11), AB1>Atg1 RNAi; dPIP4K29 (n = 9). Sample size is represented on individual bars. Unpaired t test with Welch correction showed P-value < 0.0001. (C) Graph representing average cell size measurement (in μm3) as mean ± S.E.M. of salivary glands from wandering third instar larvae of AB1/+; dPIP4K29 (n = 9), AB1>Atg8a RNAi; dPIP4K29 (n = 9). Sample size is represented on individual bars. Unpaired t test with Welch correction showed P-value < 0.0001. (D) (i) Representative confocal z-projections depicting lysosomes using LTS::mCherry in the salivary glands from the genotypes a. AB1>LTS::mCherry (control) and b. AB1>LTS::mCherry; Fab1 RNAi. Scale bar indicated at 20 μm. (ii) Graph representing measurement of LTS::mCherry punctae numbers per unit cell area of the salivary glands from wandering third instar larvae of AB1>LTS::mCherry (N = 3,n = 15) and AB1>LTS::mCherry; Fab1RNAi (N = 3,n = 15). Unpaired t test with Welch correction showed P-value < 0.0001. (iii) Graph representing measurement of average size of LTS::mCherry punctae per unit cell of the salivary glands from wandering third instar larvae of AB1>LTS::mCherry (N = 3,n = 15) and AB1>LTS::mCherry; Fab1RNAi (N = 3,n = 15). Unpaired t test with Welch correction showed P-value = 0.0104. (E) (i) Representative confocal z-projections depicting lysosomes using LTS::mCherry in the salivary glands from the genotypes a. AB1>LTS::mCherry (Control) and b. AB1>LTS::mCherry; dPIP4K29. Scale bar indicated at 20 μm (ii) Graph representing measurement of LTS::mCherry punctae numbers per unit cell area of the salivary glands from wandering third instar larvae of AB1>LTS::mCherry (N = 5,n = 25) and AB1>LTS::mCherry; dPIP4K29 (N = 2,n = 25). Unpaired t test with Welch correction showed P-value = 0.2591. (iii) Graph representing measurement of average size of LTS::mCherry punctae per unit cell of the salivary glands from wandering third instar larvae of AB1>LTS::mCherry (N = 5,n = 25) and AB1>LTS::mCherry; dPIP4K29 (N = 5,n = 25). Unpaired t test with Welch correction showed P-value = 0.0049. (F) (i) Representative confocal z-projections depicting lysosomes using Cathepsin L staining in the salivary glands from the genotypes a. w1118 (control) and b. dPIP4K29 (mutant). Scale bar indicated at 20 μm (ii) Graph representing measurement of Cathepsin L punctae numbers per unit cell area of the salivary glands from wandering third instar larvae of w1118 (control) and dPIP4K29 (mutant). unpaired t test with Welch correction showed P-value = 0.2900. (iii) Graph representing measurement of average size of Cathepsin L punctae per unit cell of the salivary glands from wandering third instar larvae of w1118 (control) and dPIP4K29 (mutant). Unpaired t test with Welch correction showed P-value < 0.0001.

