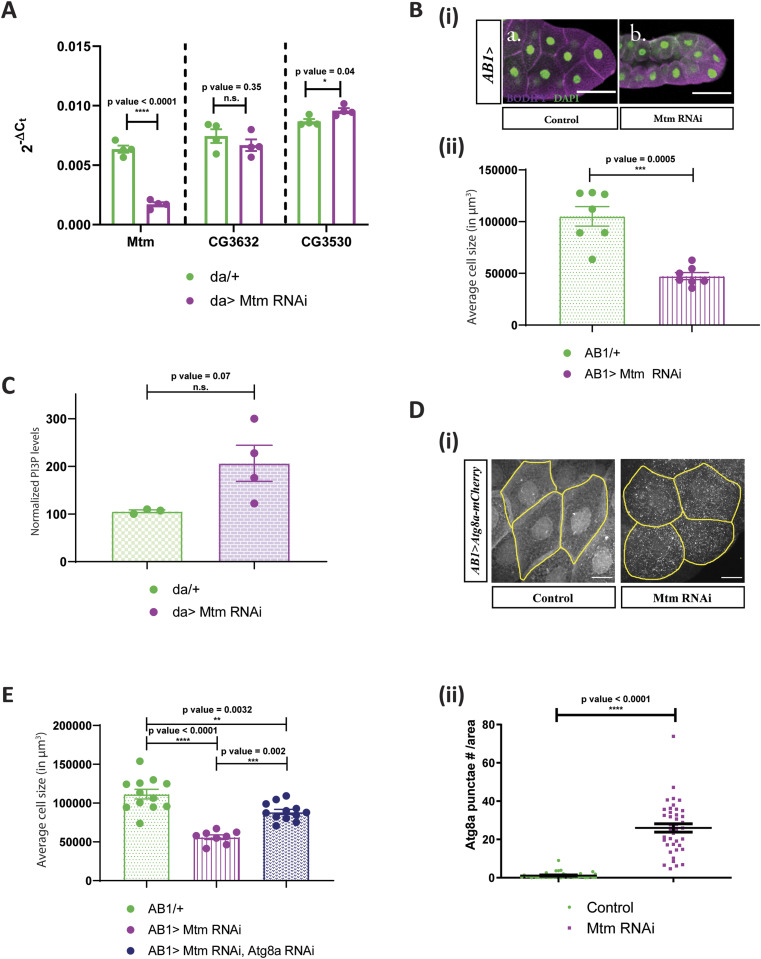
Figure 7. PI3P regulates cell size in salivary glands independent of dPIP4K.
(A) qPCR measurements for mRNA levels of Mtm, CG3632, and CG3530 from either control (da/+, in green) or da> Mtm RNAi, in magenta. Multiple t test with post hoc Holm-Sidak’s test showed P-value < 0.0001 between da/+ and da> Mtm RNAi for Mtm and P-value = 0.35 between da/+ and da> Mtm RNAi for CG3632, and P-value = 0.04 between da/+ and da> Mtm RNAi for CG3530. (B) (i) Representative confocal images of salivary glands from the genotypes a. AB1/+, b. AB1>Mtm RNAi. Cell body is marked magenta by BODIPY-conjugated lipid dye, and the nucleus is marked by DAPI shown in green. Scale bar indicated at 50 μm. (ii) Graph representing average cell size measurement (in μm3) as mean ± S.E.M. of salivary glands from wandering third instar larvae of AB1/+ (n = 7), AB1> Mtm RNAi (n = 7). Sample size is represented on individual bars. Unpaired t test with Welch correction showed P-value = 0.0005. (C) Graph representing normalised PI3P levels which is the peak area of GroPI3P/peak area of GroPI4P normalised to organic phosphate value as mean ± S.E.M. of da/+ (green) and da> Mtm RNAi (magenta). Biological samples = 4, where each sample was made from five third instar wandering larvae. Unpaired t test with Welch correction showed P-value = 0.07. (D) (i) Representative confocal z-projections depicting autophagosomal levels using Atg8a-mCherry in the salivary glands from the genotypes a. AB1>Atg8a::mCherry (control), b. AB1>Atg8a::mCherry; Mtm RNAi. Scale bar indicated at 20 μm. (ii) Graph representing Atg8a punctae measurement in the salivary glands from wandering third instar larvae of AB1>Atg8a::mCherry (N = 7, n = 40), AB1>Atg8a::mCherry; Mtm RNAi (N = 7, n = 40). Unpaired t test with Welch correction showed P-value < 0.0001. (E) Graph representing average cell size measurement (in μm3) as mean ± S.E.M. of salivary glands from wandering third instar larvae of AB1/+ (n = 11), AB1>Mtm RNAi (n = 8), AB1>Mtm RNAi, Atg8a RNAi (n = 12). Sample size is represented on individual bars. One-way ANOVA with post hoc Tukey’s test showed P-value < 0.0001 between AB1/+ and AB1>Mtm RNAi and P-value = 0.0002 between AB1/+; dPIP4K29 and AB1>Mtm RNAi, Atg8a RNAi.

