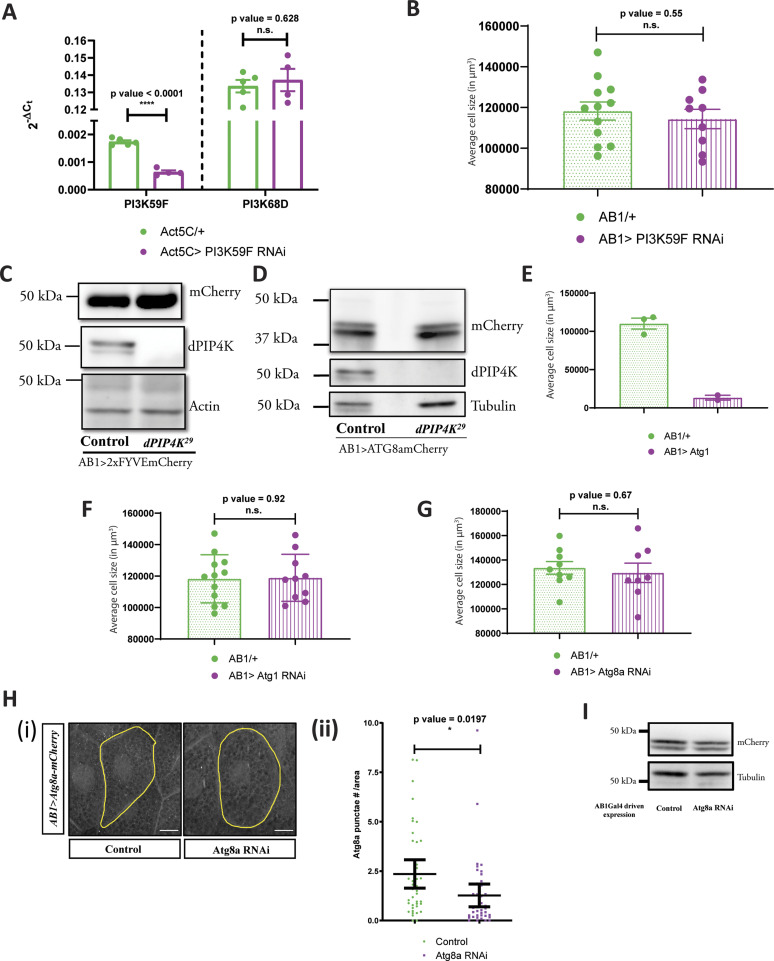
Figure S4. PIP4K regulates a non-endosomal PI3P pool in Drosophila salivary glands.
(A) qPCR measurements for mRNA levels of PI3K59F and PI3K68D from either control (Act5C/+, green) or Act5C > PI3K59F RNAi (magenta). Multiple t test with post hoc Holm-Sidak’s test showed P-value < 0.0001 between Act5C/+ and Act5C> PI3K59F RNAi for PI3K59F and P-value = 0.62 between Act5C/+ and Act5C> PI3K59F RNAi for PI3K68D. (B) Graph representing average cell size measurement (in μm3) as mean ± S.E.M. of salivary glands from wandering third instar larvae of AB1/+ (n = 12), AB1>PI3K59F RNAi (n = 9). Sample size is represented on individual bars. unpaired t test with Welch correction showed P-value = 0.55. (C) Immunoblot from the salivary glands of wandering third instar larvae probed using mCherry antibody showing the expression of 2XFYVE-mCherry in AB1>2XFYVE::mCherry (control) and AB1>2XFYVE::mCherry; dPIP4K29. 2XFYVE-mCherry migrates ∼50 kD. Actin was used as the loading control. dPIP4K protein was checked in the samples to ascertain the mutant background. (D) Immunoblot from the salivary glands of wandering third instar larvae probed using mCherry antibody showing the expression of Atg8a-mCherry in AB1>Atg8a::mCherry (Control) and AB1>Atg8a::mCherry; dPIP4K29. Atg8a-mCherry migrates ∼42 kD. Tubulin was used as the loading control. dPIP4K protein was checked in the samples to ascertain the mutant background. (E) Graph representing average cell size measurement (in μm3) as mean ± S.E.M. of salivary glands from wandering third instar larvae of AB1/+ (n = 3), AB1> Atg1 (n = 2). Sample size is represented on individual bars. Statistical test is not performed. (F) Graph representing average cell size measurement (in μm3) as mean ± S.E.M. of salivary glands from wandering third instar larvae of AB1/+ (n = 12), AB1> Atg1 RNAi (n = 10). Sample size is represented on individual bars. Unpaired t test with Welch correction showed P-value = 0.92. (G) Graph representing average cell size measurement (in μm3) as mean ± S.E.M. of salivary glands from wandering third instar larvae of AB1/+ (n = 9), AB1>Atg8a RNAi (n = 8). Sample size is represented on individual bars. Unpaired t test with Welch correction showed P-value = 0.67. (H) (i) Representative confocal z-projections depicting autophagosomal levels using Atg8a::mCherry in the salivary glands from the genotypes a. AB1>Atg8a::mCherry (control), b. AB1>Atg8a::mCherry; Atg8aRNAi. Scale bar indicated at 20 μm. (ii) Graph representing Atg8a punctae measurement in the salivary glands from wandering third instar larvae of AB1>Atg8a::mCherry (N = 8, n = 40) and AB1>Atg8a::mCherry; Atg8aRNAi (N = 8, n = 40). Unpaired t test with Welch correction showed P-value = 0.0197. (I) Immunoblot from the salivary glands of wandering third instar larvae probed using mCherry antibody showing the expression of Atg8a-mCherry in AB1>Atg8a::mCherry (control) and AB1>Atg8a::mCherry; Atg8aRNAi. Atg8a::mCherry migrates ∼42 kD. Actin was used as the loading control.

