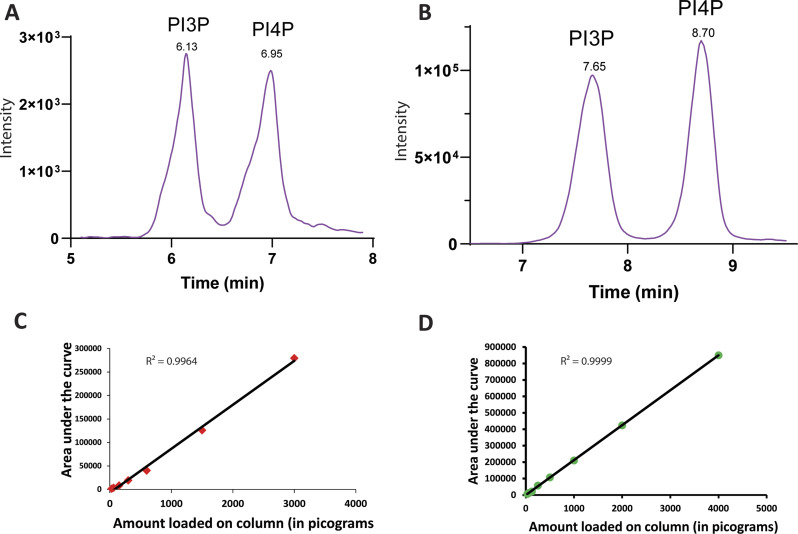
Figure S6. Mtm reduces PI3P levels when over-expressed in dPIP4K29.
(A) XIC obtained from a mixture of synthetic GroPI3P and GroPI4P standard mixture at 300 pg on column eluting at Rt = 6.13 min and Rt = 6.95 min, respectively. (B) XIC obtained from a biological sample spiked with 200 pg of synthetic GroPI3P, eluting at Rt = 7.65 min and GroPI4P eluting at Rt = 8.70 min, respectively. The area under the curve for GroPI3P changed by 29 times whereas the area under the curve of GroPI4P changed by 1.5 times, indicating that the first peak obtained in biological samples is indeed GroPI3P. (C) A dose–response curve of synthetic GroPI3P ranging from 30–3,000 pg on the column. Y-axis depicts intensity of GroPI3P (in cps) and X-axis represents the amount of GroPI3P loaded on column. Equation: y = 93.704x - 7243.1; R2 = 0.9964. (D) A dose–response curve of synthetic GroPI4P ranging from 30–4,000 pg on the column. Y-axis depicts intensity of GroPI4P (in cps) and X-axis represents the amount of GroPI4P loaded on the column. Equation: y = 212.49x–505.82; R2 = 0.9999.

