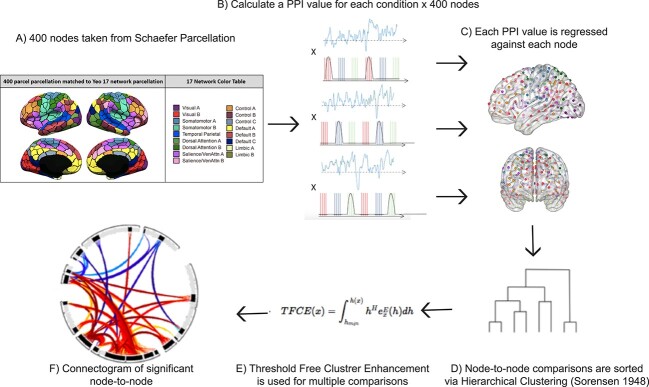
Fig. 2.
Step by step method of gPPI analysis implemented in Conn toolbox. A) an inflated image of the 400 cortical nodes matched to the Yeo 17-network atlas (adapted with permission from https://github.com/ThomasYeoLab/CBIG/tree/master/stable_projects/brain_parcellation/Schaefer2018_LocalGlobal). B) A representation of the psychophysiological index regressors utilized in the gPPI analysis. For each of the three conditions, LTM-guided attention, STIM-guided attention, and LTM-retrieval, the block design was multiplied by the time-series of each of the 400 nodes separately to create individual PPI regressors. C) each PPI regressor is used to compute beta values for all possible pairwise comparisons amongst the 400 nodes. D) Beta values were extracted and sorted using hierarchical clustering available in Conn toolbox. This clustering method groups nodes together based on functional similarity and anatomical proximity. E) Threshold free cluster enhancement (TFCE) with P < 0.01 is run to correct each node-to-node connectivity pair for multiple comparisons. F) a node-to-node connectogram is constructed within Conn toolbox that displays clusters of connections between ROIs that pass TFCE correction.

