
Fig. 5.
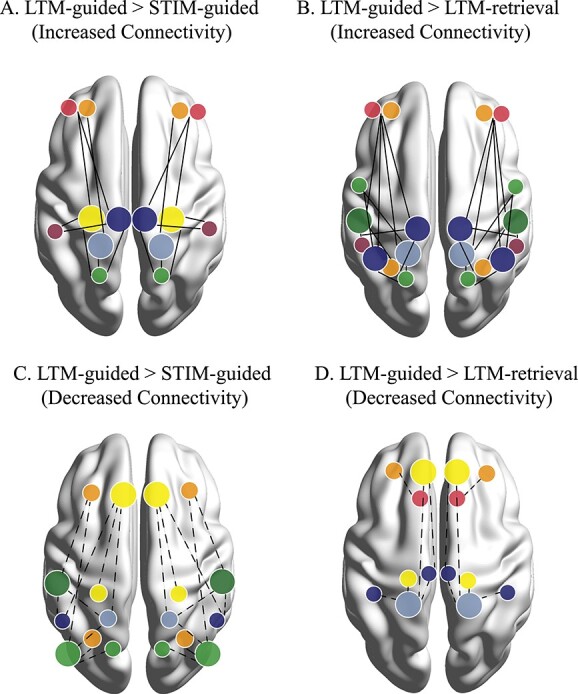
Conceptual figure illustrating main network interactions resulting from each of the contrasts. Networks are color coded based on the Yeo 17 colors shown in Figs 3 and 4. Prominent nodes of the contrast are denoted by larger dots on the brain. Significant but less recurring nodes are denoted by smaller dots. Solid lines indicate increased connectivity between two nodes for a) LTM-guided > STIM-guided attention, and B) LTM-guided attention > LTM-retrieval. dotted lines indicate decreased connectivity between two nodes for C) LTM-guided > STIM-guided attention, and D) LTM-guided attention > LTM-retrieval. notably, LTM-guided > STIM-guided attention seems to employ connectivity from posterior nodes of the memory-attention network, while LTM-guided attention > LTM-retrieval highlights a role for brain regions involved in visuospatial and external processing.