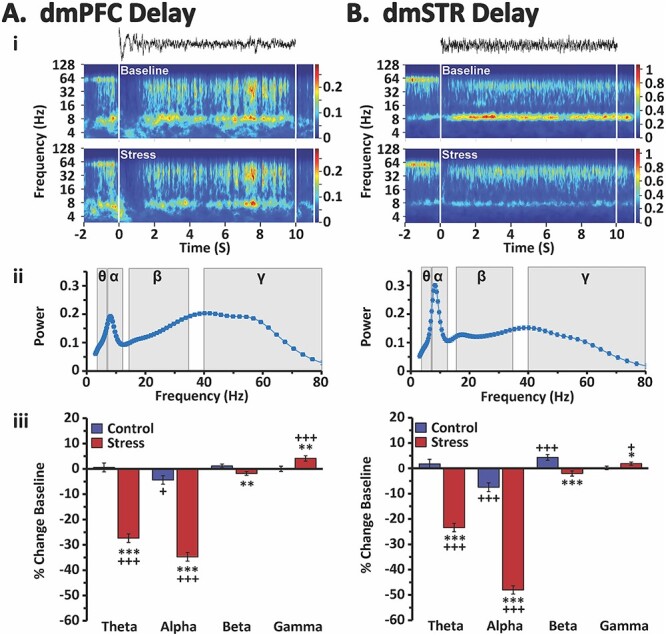
Fig. 4.

Stress effects on delay-related oscillatory activity in the dmPFC and dmSTR. Shown are analyses of delay-related LFP oscillatory activity in the dmPFC A) and dmSTR B). i) Raw LFP recording traces during a 10-s delay interval of a single trial (top) and time-frequency spectrograms for the delay interval averaged across all trials of an individual animal during both baseline (middle) and stress (bottom) recording sessions. White vertical lines indicate beginning and end of the delay interval. Color scale bar reflects absolute power of LFP. ii) Spectral density plots of mean power for all animals during the delay interval of baseline testing (4–80 Hz). Shading indicates theta (θ), alpha (α), beta (ß), and gamma (γ) frequencies. Under baseline conditions there was a peak spanning theta and alpha frequencies, reaching a maximum at ~ 8 Hz (low alpha) followed by a broader peak that reached a maximum at low gamma. iii) Percent change in power (± SEM) from baseline during the delay interval for each analyzed frequency band for stress and no-stress control animals. Stress robustly suppressed delay-related theta and alpha power, while modestly suppressing beta activity, in both the dmPFC and dmSTR. Conversely, stress elicited a small, yet significant increase in delay-related gamma power in both regions. *P < 0.05, **P < 0.01, ***P < 0.001 vs. no-stress control. +P < 0.05, +++P < 0.001 vs. baseline.
