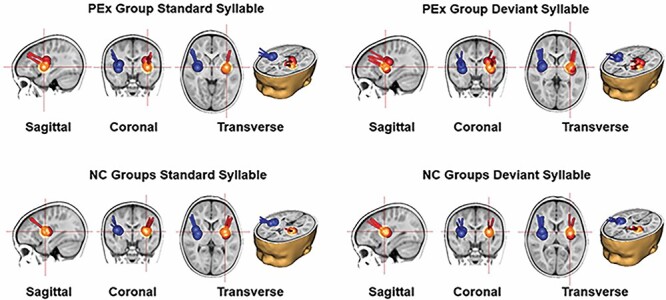
Fig. 1.

Source localization: source localization of the P1 peak generators based on the grand average ERP is shown in sagittal, coronal, and transverse views in a 0–18 months infant brain template. Dipoles in red represent sources localized in the LAC and in blue, in the RAC, whereas the red crosshairs highlight the left dipole location. In the first row to the left, the dipole models representing the response to the STD syllable /da/ for the longitudinal PEx group at 7, 9, 12, and 18 months of age are displayed superimposed in the infant brain template. In the first row to the right, the dipole models representing the response to the DEV syllable /ta/ at all 4 ages are displayed superimposed in the infant brain template. In the second row, source localization for the STD to the left and the DEV to the right for the 4 cross-sectional NC groups (NC07, NC09, NC12, NC18) are displayed superimposed in the infant brain template.
