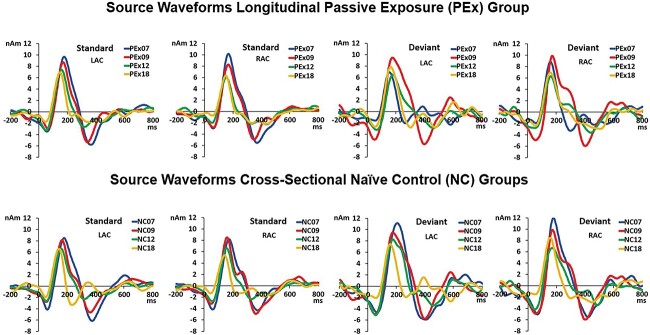
Fig. 2.
Source waveforms: first row: grand average source waveforms for the longitudinal PEx group followed across age. The first 2 source waveforms represent responses in the LAC and RAC to the STD syllable /da/. The next 2 source waveforms represent responses in LAC and RAC to the DEV syllable /ta/. The source waveforms are shown superimposed at 7 months in blue, at 9 months in red, at 12 months in green, and at 18 months in yellow. Second row: grand average source waveforms for the 4 cross-sectional NC groups. The first 2 source waveforms represent responses in the LAC and RAC to the STD syllable /da/. The next 2 source waveforms represent responses in LAC and RAC to the DEV syllable /ta/. The source waveforms are shown superimposed for the NC07 group in blue, for the NC09 group in red, for the NC12 group in green, and for the NC18 group in yellow. Positivity is plotted up, time is shown in ms on the x-axis, and amplitude is given in nanoampere meters (nAm) on the y-axis.

