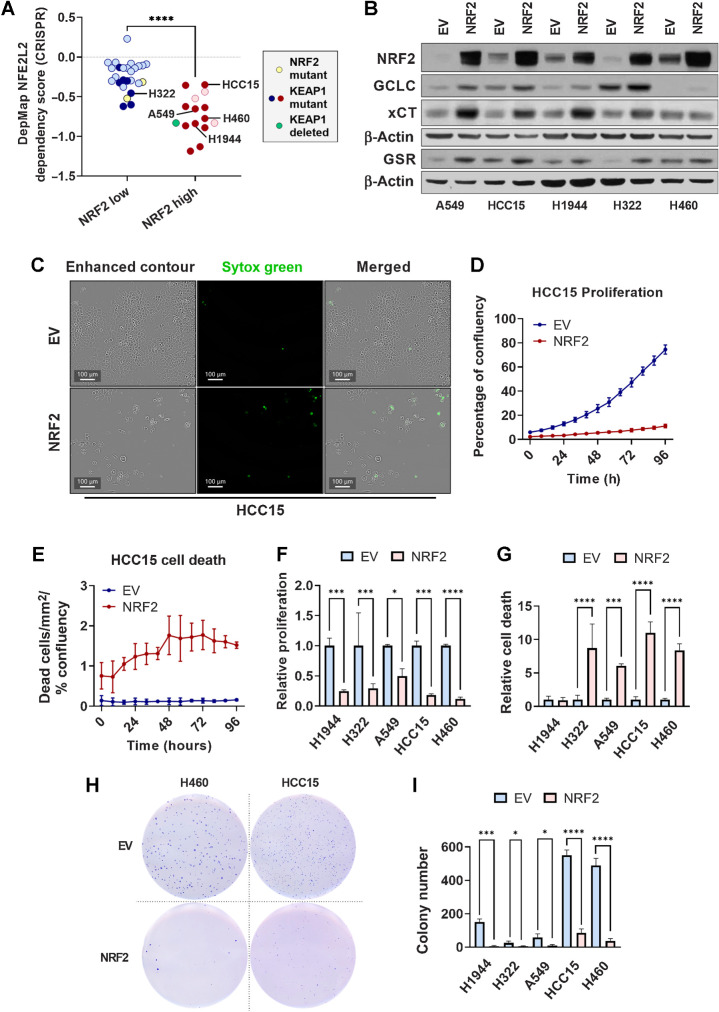
Figure 7.
NRF2 overexpression impairs lung cancer cell proliferation, viability, and soft agar colony formation. A, Dependency scores obtained from DepMap (45) and represented as NFEL2 22Q2 Public+Score, Chronos for NSCLC cell lines previously determined to have high or low NRF2 activity (24). Yellow symbols, NRF2 mutant line; dark red or dark blue symbols, KEAP1 mutant lines; green symbol, KEAP1-deleted lines. ****, P < 0.0001 (unpaired t test). B, Western blot analysis of NRF2, β-actin, and NRF2 target GCLC, xCT, and GSR expression in KEAP1 mutant lung cancer cell lines transduced with PLX317-empty vector (EV) or PLX317-NRF2 (NRF2). C, Representative images of HCC15 cells transduced with empty vector or NRF2 demonstrating cell confluency (enhanced contour) and cell death (Sytox Green). Scale bars, 100 μm. D and E, Analysis of empty vector and NRF2 HCC15 cell proliferation and death over 96 hours. Proliferation is represented as the percentage of confluency at each time point, and cell death as the number of Sytox Green–positive cells per area normalized to the percentage of confluency. N = 3 technical replicates per cell line and two independent experiments. F and G, AUC analysis of cell proliferation (F) and Sytox Green–positive cell death (G) in KEAP1 mutant lung cancer cells lines ± NRF2, normalized to empty vector control. *, P < 0.05; ***, P < 0.001; ****, P < 0.0001 (one-way ANOVA). C–G, NSCLC cells were seeded in triplicate in 96-well plates at a density of 2,500 cells/well. H, Representative images of H460 and HCC15 soft agar colony formation ± NRF2. I, Quantification of soft agar colony number of KEAP1 mutant lung cancer cell lines. *, P < 0.05; ***, P < 0.001; ****, P < 0.0001 (one-way ANOVA). N = 3 technical replicates per cell line; two independent experiments. H and I, 5,000 cells per well were seeded in 6-well plates in triplicate.

