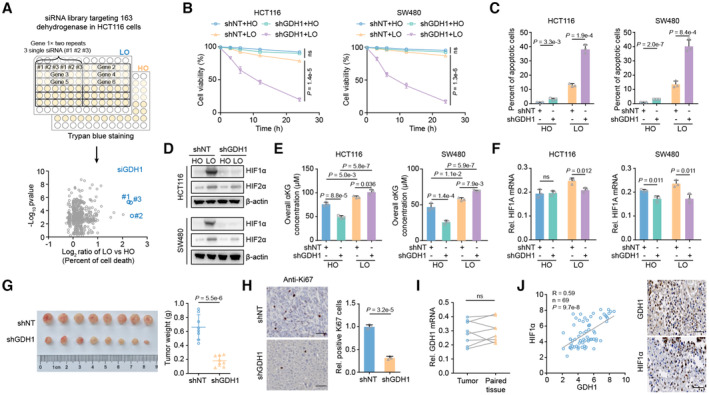
Figure 1. GDH1 confers tumor cell resistance to hypoxia and promotes tumorigenesis.

-
AThe workflow for screening the dehydrogenase‐coding genes required for resisting hypoxia in HCT116 cells. In detail, HCT116 cells were collected and plated in 96‐well plates. Cells were transiently transfected with siRNAs separately targeting 163 dehydrogenase‐coding genes identified in the KEGG database using RNAiMAX for 36 h, treated with or without hypoxia for 24 h, and finally stained with Trypan blue. The origin of siRNA library was released from horizondiscovery website. The x‐axis represents the log2‐transformed fold changes in the percentage of dead cells among LO‐ vs. HO‐treated cells. Normoxia, 20% oxygen, is also termed HO. Hypoxia, 0.5% oxygen, is also termed LO.
-
BHCT116 and SW480 cells with GDH1 knockdown were incubated under normoxia and hypoxia, respectively. Then, cell viability was assessed by trypan blue staining (n = 3).
-
CThe cells in (B) were collected after incubation under normoxia or hypoxia, and PI/Annexin V double staining was then used to measure the percentage of apoptotic cells via FACS (n = 3).
-
DThe cells in (B) were collected after incubation under normoxia or hypoxia induction for 6 h, and the HIF1α protein level was measured via immunoblot analysis.
-
EHCT116 and SW480 cells with GDH1 knockdown were incubated under normoxia and hypoxia, respectively. Then, overall αKG was assessed using an αKG assay kit (Abcam) (n = 3).
-
FHIF1A gene transcription was slightly impaired after GDH1 depletion. The cells in (B) were collected after incubation under normoxia or hypoxia, and the HIF1A mRNA level was analyzed via quantitative real‐time PCR (qRT–PCR) (n = 3; ns, not significant).
-
G, HTumor formation study. HCT116‐shNT and HCT116‐shGDH1 cells were injected into the left groin of nude mice. When the tumor size reached 300 mm3, the mice were sacrificed, and the tumors were removed for further experiments (n = 8) (G). Solid tumors were stained with an antibody against Ki67 (Scale bars: 50 μm) (n = 3) (H).
-
IThe relative mRNA level of GDH1 was determined in 8 paired CRC and adjacent tissues (n = 8).
-
JPositive correlation between GDH1 and HIF1α protein expression in CRC tissue.
Data information: Data are mean ± SD from the biological replicates (B, C, E–H). Statistics: two‐way ANOVA with Tukey's HSD post hoc test (B); unpaired two‐tailed student's t‐test (C, F–H, J); one‐way ANOVA followed by with Tukey's HSD post hoc test (E); paired two‐tailed Student's t‐test (I).
Source data are available online for this figure.
