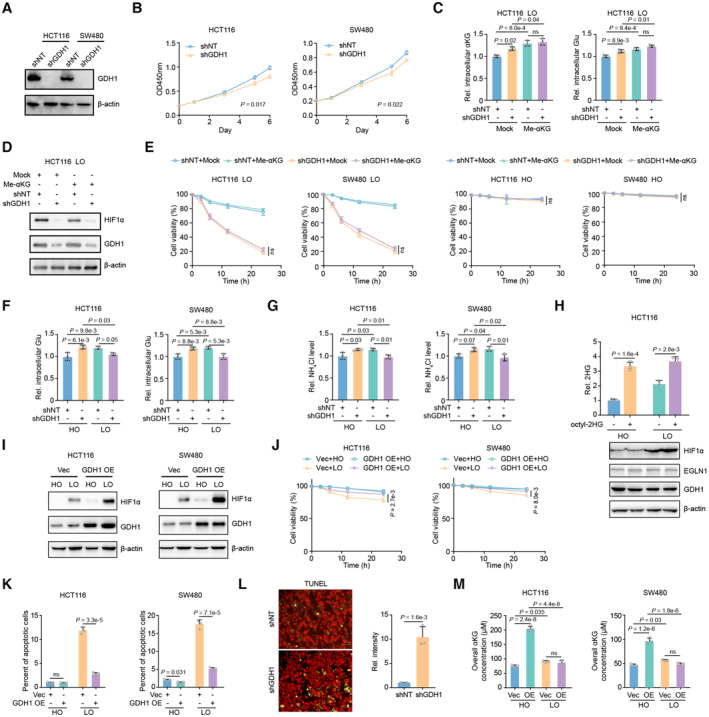
Figure EV1. GDH1 depletion sensitizes CRC cells to hypoxia.

-
AConstruction of GDH1 depleted cell lines.
-
BCell proliferation assay was performed using cell lines constructed in Fig S1A (n = 3).
-
C, DHCT116 and SW480 cells with or without GDH1 were supplemented with cell permeable methyl‐αKG under hypoxia. Then, the intracellular level of αKG was tested by αKG determination kit (C) (n = 3). Cells were collected and indicated antibodies were applied to test HIF1α, EGLN1 and GDH1 proteins (D).
-
EHCT116 and SW480 cells with or without GDH1 were supplemented with cell permeable methyl‐αKG under normoxia and hypoxia. Then, cell viability was counted by trypan blue staining (n = 3).
-
F, GHCT116 and SW480 cells with or without GDH1 were cultured under normoxia or hypoxia. Cells were collected for determining glutamate (Glu, F) and ammonia (NH4Cl, G) (n = 3).
-
HHCT116 were incubated with or without cell permeable octyl‐2HG under normoxia or hypoxia. Indicated antibodies were applied to test HIF1α, EGLN1 and GDH1 proteins (n = 3).
-
IHIF1α and GDH1 were tested by western blot in HCT116 or SW480 cells with Vec or GDH1 overexpression under normoxia and hypoxia.
-
JHCT116 and SW480 cells with or without GDH1 overexpression were incubated under normoxia and hypoxia, respectively. Then, cell viability was counted by trypan blue staining (n = 3).
-
KThe apoptotic percent of cells in Fig S1D was counted by PI/Annexing V double staining (n = 3).
-
LTUNEL analysis of GDH1 knockdown HCT116 cells under hypoxia. The left was the representative microscopic data, the right was the calculated relative intensity data (n = 3).
-
MThe overall αKG level in HCT116 or SW480 cells with or without GDH1 overexpression under normoxia and hypoxia (n = 3).
Data information: Data are mean ± SD from the biological replicates (B, C, E–H, J–M). Statistics: two‐way ANOVA with Tukey's HSD post hoc test (B, E, J); one‐way ANOVA with Tukey's HSD post hoc test (C, F–H, M); unpaired two‐tailed Student's t‐test (K, L).
Source data are available online for this figure.
