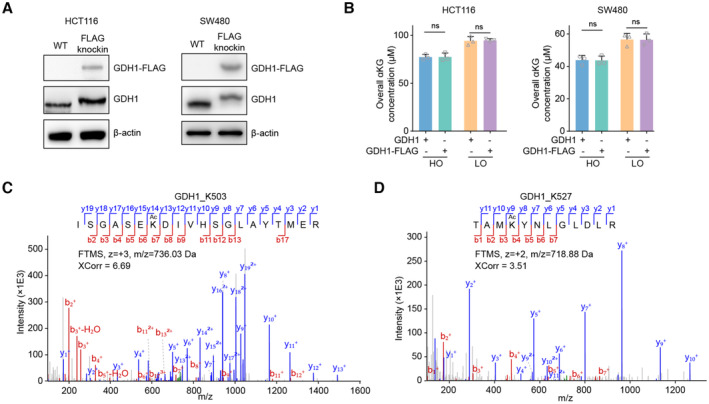
Figure EV3. The enrichment of GDH1 for acetylation identification.

-
AThe successful knockin of FLAG into C terminal of GDH1 in HCT116 or SW480 cells was tested by western blot.
-
BThe overall αKG level in HCT116 or SW480 cells with or without FLAG tagging endogenous GDH1 C terminal under normoxia and hypoxia (n = 3).
-
C, DMS/MS spectra identified K503 and K527 acetylation of GDH1 purified from HCT116 cells.
Data information: Data are mean ± SD from the biological replicates (B). Statistics: unpaired two‐tailed Student's t‐test (B).
Source data are available online for this figure.
