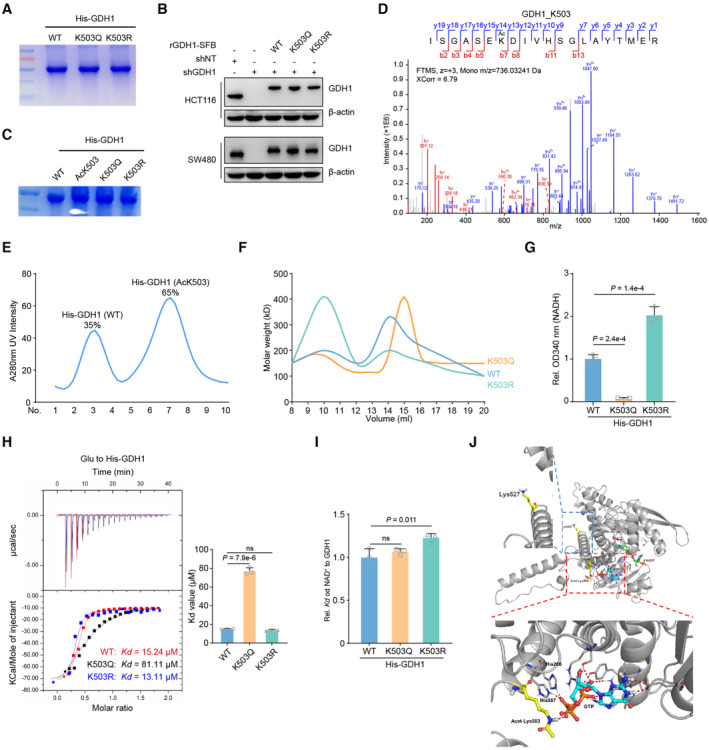
Figure EV4. GDH1‐K503 acetylation modulates its enzyme activity.

- His‐GDH1 (including WT, K503Q and K503R mutants) were purified from E. coli and separated by SDS‐PAGE. The coomassie blue staining was shown.
- Construction of GDH1‐depleted cell lines, which were rescued with expression of WT GDH1 or K503Q, or K503R mutant GDH1.
- His‐GDH1 (including WT, AcK503, K503Q and K503R mutants) were purified from E. coli and separated by SDS‐PAGE. The coomassie blue staining was shown.
- The acetyl modification of AcK503 His‐GDH1 from E. coli was confirmed by LC–MS/MS.
- His‐GDH1 (including WT and AcK503) purified from E. coli were separated and analyzed by FPLC.
- His‐GDH1 (including WT and AcK503) purified from E. coli were analyzed by dynamic light scattering.
- Measure the NADH level by the OD340 absorbance value, respectively (n = 3).
- His‐GDH1 proteins (including WT, K503Q or K503R) were purified from E. coli to determine Kd value. ITC assays were performed with precipitated His‐GDH1 proteins and αKG (n = 3)
- ITC assays were performed with precipitated His‐GDH1 proteins and NAD+ (n = 3)
- The complex of GDH1 (PDB code: 4ED5) with GTP is superimposed on the GDH1‐GTP complex. The protein and metabolites are shown as cartoon and are colored gray and orange or yellow, respectively. Acetyl‐K503, K527 and GTP are shown as sticks.
Data information: Data are mean ± SD from the biological replicates (G–I). Statistics: one‐way ANOVA with Tukey's HSD post hoc test (G–I).
Source data are available online for this figure.
