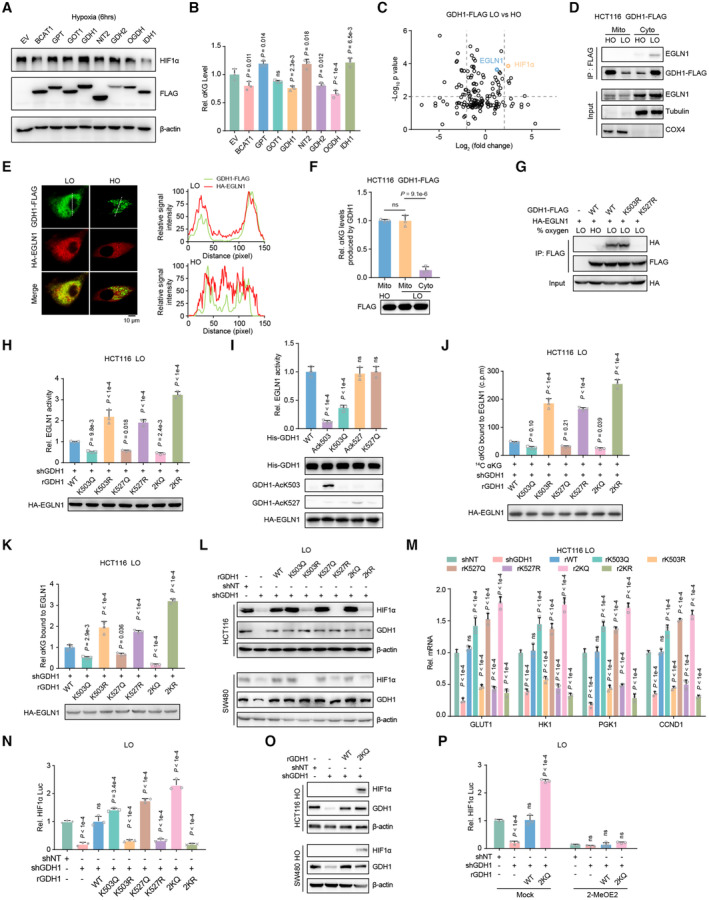
Figure 5. Tumor cells require both GDH1‐K503 and GDH1‐K527 acetylation to simultaneously reduce EGLN1 activity under hypoxia.

-
A, BImmunoblot of the HIF1α protein level under hypoxia for 6 h when enzymes related to the αKG level were overexpressed in cells, including GDH1 (A). Relative αKG levels in contrast to the control (B) (n = 3).
-
CHCT116‐GDH1‐FLAG cells were incubated under normoxia and hypoxia. Cells were then collected, and M2 flag beads were used to enrich FLAG‐tagged GDH1. GDH1‐FLAG‐associated proteins were identified by LC–MS/MS. The fold change was evaluated as the ratio of expression under hypoxia to that under normoxia. The x‐axis represents the log2‐transformed fold change, and the y‐axis represents the minus log10‐transformed P‐value.
-
DA Co‐IP assay was performed to test the interaction between GDH1 and EGLN1 in the cytosolic and mitochondrial fractions from HCT116‐GDH1‐FLAG cells.
-
EImmunofluorescence analysis of GDH1‐FLAG and HA‐EGLN1 was performed to assess their colocalization under normoxia and hypoxia.
-
FGDH1‐FLAG was enriched in the cytosolic and mitochondrial fractions from HCT116‐GDH1‐FLAG cells, and the enzymatic activity of GDH1 in producing αKG was evaluated (n = 3).
-
GHCT116 cells were cotransfected with plasmids encoding GDH1‐FLAG and HA‐EGLN1. A Co‐IP assay was performed to examine whether the K503R or K527R mutation affected the interaction between GDH1 and EGLN1.
-
H, IEGLN1 activity test. After hypoxia stimulation for 1 h, HA‐EGLN1 was enriched in HCT116‐shGDH1 cells restored with WT or mutant GDH1 (H). His‐GDH1 with K503 or K527 acetylation (AcK503 or AcK527) and mimic acetylation at K503 or K527 (K503Q or K527Q) were purified from E. coli. Then, His‐GDH1 was incubated for 1 h with HA‐EGLN1 (I). EGLN1 activity was tested by converting αKG to succinate (n = 3).
-
J, KRelative αKG content in EGLN1. HA‐EGLN1 was enriched in shNT or shGDH1 cells under hypoxia. A radiometric 14C‐αKG‐EGLN1 binding assay was performed using HA‐EGLN1 incubated with 14C‐αKG (J). Alternatively, the HA‐EGLN1 protein was digested by trypsin, and αKG was determined by LC–MS/MS analysis (K) (n = 3).
-
L–NDetection of HIF1α protein stability (L); the mRNA expression levels of the HIF1α target genes GLUT1, HK1, PGK1 and CCND1 (M); and HIF1α transactivation (N) in the indicated cell lines under hypoxia (n = 3).
-
ODetection of HIF1α protein stability in the indicated cell lines under normoxia.
-
PHIF1α transactivation was examined in the indicated cell lines under hypoxia with or without treatment with the HIF1α transactivation inhibitor 2‐MeOE2 (1 μM) for 12 h (n = 3).
Data information: Data are mean ± SD from the biological replicates (B, F, H–K, M, N, P). Statistics: one‐way ANOVA with Tukey's HSD post hoc test (B, F, H–K, M, N, P); unpaired two‐tailed Student's t‐test (C).
Source data are available online for this figure.
