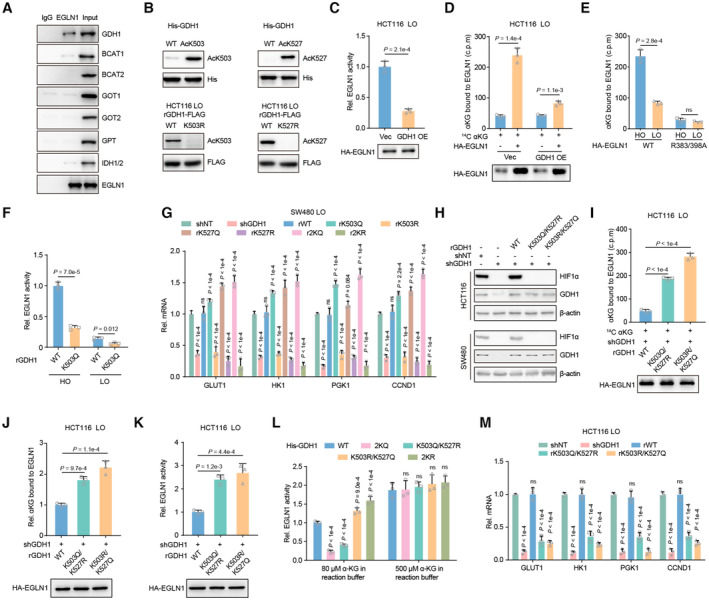
Figure EV5. Acetylation modification at both K503 and K527 regulates the survival of CRC cells under hypoxia.

-
AEGLN1 was enriched from hypoxia pretreated HCT116 cells and indicated antibodies were applied to test the association of EGLN1 with αKG producing or consuming metabolic enzymes.
-
BThe specificity of antibodies against GDH1‐AcK503 or ‐AcK527 was analyzed by western blot. His‐ GDH1‐AcK503 or ‐AcK527 was prepared from E. coli. Restored expression of GDH1‐FLAG (including WT, K503R and K527R) was enriched from HCT116 cells.
-
CHA‐EGLN1 was enriched from HCT116 cells with or without GDH1 overexpression under hypoxia and then EGLN1 activity was tested by converting αKG to succinate (n = 3).
-
DRelative αKG in EGLN1. HA‐EGLN1 was enriched from Vec or GDH1 OE cells under hypoxia. A radiometric 14C‐αKG‐EGLN1 binding assay was performed using HA‐EGLN1 incubating with 14C‐αKG (n = 3).
-
ENegative control used for testing relative αKG in EGLN1. HA‐EGLN1 (including WT and R383/398A mutant) was enriched from HCT116 under normoxia and hypoxia. A radiometric 14C‐αKG‐EGLN1 binding assay was performed using HA‐EGLN1 incubating with 14C‐αKG (n = 3).
-
FMeasure the relative EGNL1 activity affected by restored WT or K503Q GDH1 under normoxia or hypoxia in vitro (n = 3).
-
GThe mRNA expression of HIF1α target genes, GLUT1, HK1, PGK1 and CCND1 was tested in indicated cell lines (n = 3).
-
HDetection of HIF1α protein stability in GDH1 depleted cell lines which were rescued with expression of WT GDH1 or K503Q/K527R or K503R/K527Q mutant GDH1.
-
I, JRelative αKG in EGLN1. HA‐EGLN1 was enriched from indicated cells under hypoxia. A radiometric 14C‐αKG‐EGLN1 binding assay was performed using HA‐EGLN1 incubating with 14C‐αKG (H). EGLN1 was digested by trypsin and LC–MS was applied to detect αKG eluted from EGLN1 (I) (n = 3).
-
KHA‐EGLN1 was enriched from indicated genetic manipulated HCT116 cells under hypoxia and then EGLN1 activity was tested by converting αKG to succinate (n = 3).
-
LHA‐EGLN1 was enriched from HCT116 cells under hypoxia and then incubated with indicated His‐GDH1 in the buffer containing 80 or 500 μM αKG. EGLN1 activity was tested by converting αKG to succinate (n = 3).
-
MThe mRNA expression of HIF1α target genes, GLUT1, HK1, PGK1 and CCND1, in indicated cell lines (n = 3).
Data information: Data are mean ± SD from the biological replicates (C–G, I–M). Statistics: unpaired two‐tailed Student's t‐test (C–F); one‐way ANOVA with Tukey's HSD post hoc test (G, I–M).
Source data are available online for this figure.
