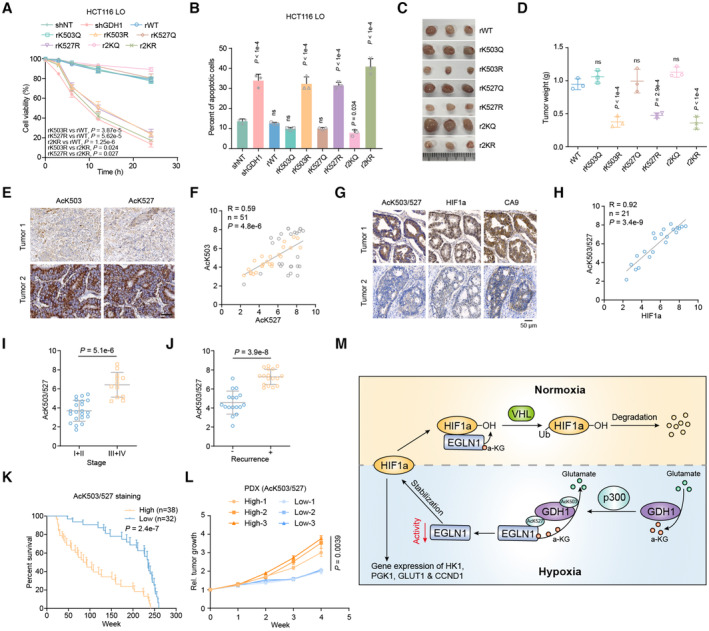
Figure 7. AcK503/527‐GDH1 indicates a poor prognosis, mainly dependent on HIF1α stabilization.

-
A, BCell viability and percentage of apoptosis in the indicated cell lines under hypoxia were analyzed by trypan blue (A) and PI/Annexin V double staining (B), respectively (n = 3).
-
C, DThe xenograft tumor formation efficiency of the indicated cell lines was assessed, and tumor weight measurements were performed (n = 3).
-
ERepresentative images of CRC samples are shown after antibody staining of AcK503‐GDH1 and AcK527‐GDH1.
-
FThe correlation between AcK503‐GDH1 and AcK527‐GDH1 expression in CRC samples. The tissue sections were quantitatively scored according to the percentage of positive cells and the staining intensity (H‐score) (n = 51).
-
GRepresentative images of the same CRC samples are shown after staining with antibodies against AcK503/527‐GDH1 and HIF1α.
-
HCorrelation between AcK503/527‐GDH1 and HIF1α expression in CRC samples (n = 21).
-
IDetection of AcK503/527‐GDH1 expression in CRC grades I + II and III + IV (grade I + II, n = 21; grade III + IV, n = 12).
-
JDetection of AcK503/527‐GDH1 expression in patients with (+) or without (−) recurrence (−, n = 17; +, n = 17).
-
KPatient survival corresponding to different levels of AcK503/527‐GDH1 expression (High, n = 38; Low, n = 32).
-
LPDX growth related to high or low levels of AcK503/527‐GDH1 expression.
-
MSchematic model described in the discussion section.
Data information: Data are mean ± SD from the biological replicates (A, B, D, I, J, L). Statistics: two‐way ANOVA with Tukey's HSD post hoc test (A, L); one‐way ANOVA with Tukey's HSD post hoc test (B, D); unpaired two‐tailed Student's t‐test (F, H); Mann–Whitney U‐test (I, J); log‐rank test (K).
Source data are available online for this figure.
