Fig. 1.
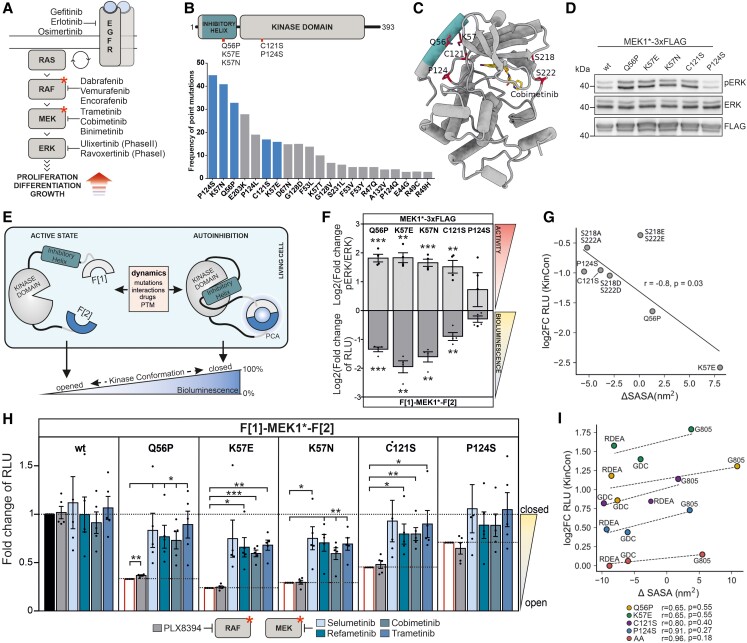
Mutation and inhibitor-induced effects on MEK1 conformation in cells and in silico. A) Overview of the MAPK pathway and indication of selected kinase inhibitors. B) MEK1 domain organization showing the N-terminal inhibitory helix A and kinase domain. MEK1 patient mutations are highlighted. The respective mutation frequencies are indicated (COSMIC database) and selected ones investigated. C) 3D model of human MEK1 bound to Cobimetinib (derived from PDB 1SJ9 and 3EQI). The inhibitory helix A is colored. MEK1 sites S218/S222 (RAF phosphorylation) are indicated. D) ERK1/2 phosphorylation upon overexpression of the indicated MEK1-triple-Flag fusion proteins. One representative western blot out of n = 4 independent experiments is shown. Statistical evaluation is included in F). E) Schematic representation of the MEK1 kinase conformation (KinCon) reporter, fragments of the Renilla luciferase are indicated with F[1] and F[2]. Inhibitor binding, protein–protein interactions (PPI), patient mutations, or posttranslational modifications (PTM) convert the MEK1-KinCon reporter into different kinase conformation states, altering the PCA-emitted bioluminescence signals. F) Effect of patient mutations on MEK1-KinCon dynamics and pERK level. Bars represent log2 of the mean of mutation-induced elevation of the pERK/ERK ratio and reduction in the bioluminescence signal, respectively. Bioluminescence was measured 48 h post transfection, normalized to expression levels determined by western blot and compared with wt MEK1 (±SEM, n = 4). HEK293T lysates expressing the corresponding MEK1 construct were subjected to western blotting and the pERK/ERK ratio was determined relative to the wt MEK1 pERK/ERK ratio (±SEM, n = 4). Further, a significant negative correlation between RLU and pERK levels was determined with a two-tailed nonparametric Spearman correlation test (*P < 0.0167). G) Log2 of the data of n = 3 shown in F) is blotted against the change in solvent accessible surface area (SASA). The change in maximum SASA of MEK1 mutants as measured by MD simulation is negatively correlated with the change in RLU as measured by the KinCon reporter assay. H) Determination of structural rearrangements of mutant MEK1-KinCon reporters after exposure to 1 µM of indicated MEKi, PLX8394, or DMSO for 1 h. Measured bioluminescence signals were normalized to the respective DMSO control of each KinCon reporter and adjusted to the levels of untreated samples (data from F lower part before log2 transformation) and (±SEM, N = 5). I) Log2 representation of the data of n = 4 shown in H) is blotted against the change in solvent accessible surface area (SASA). The difference in maximum SASA between wt and mutant is positively correlated with a given mutant's change in RLU. Statistical significance for F and H) One-sample t-test (*P < 0.05, **P < 0.01, ***P < 0.001). MEKi: RDEA, Refametinib; GDC, Cobimetinib; G805, Selumetinib; Trametinib.

