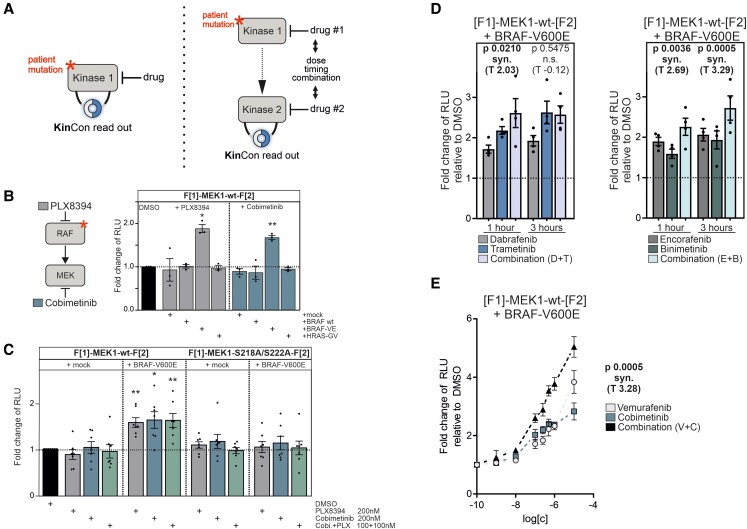
Fig. 2.
RAF-MEK interdependencies in cells tracked using the KinCon technology. A) KinCon reporter dynamics can be measured at different levels of a signal cascade. (left) The direct impact of a mutation and/or inhibitor. (right) Mutations/drugs impact on kinase 1 which affects kinase 2. The interplay of both drugs on the kinase structures is recorded. B) Effect of 1 µM treatment of Cobimetinib or PLX8394 for 1 h on MEK1-KinCon reporter dynamics in the presence of BRAF, BRAF-V600E, HRAS-G12V, or empty vector. Bars represent the mean of measured bioluminescence signals relative to DMSO (±SEM, n = 3). C) Dose-dependent effect of a 1 h inhibitor treatment on indicated MEK1-KinCon dynamics in the presence and absence of BRAF-V600E. Cells were treated as indicated schedules. Bars represent the mean bioluminescence signals relative to DMSO (±SEM, n = 7). D) Impact of MEKi and BRAFi combinations on the wt MEK1-KinCon in the presence of BRAF-V600E or mock. Single agents (100 nM) or drug combinations (100 nM each; total 200 nM) were applied for 1 or 3 h. Bars represent the mean bioluminescence signals relative to DMSO (±SEM, n = 4). E) Impact of dose-dependent Vemurafenib, Cobimetinib, or respective combination treatment on the wt MEK1-KinCon in the presence of BRAF-V600E. Symbols represent the mean bioluminescence signals relative to DMSO at increasing inhibitor concentrations on a logarithmic scale (±SEM, n = 6). The Min test was used in panels D and E to assess the synergistic effect of a drug combination relative to the effects of the combination's constituent drugs (P < 0.05 synergism). Unless otherwise specified, a one-sample t-test was used to evaluate statistical significance (*P < 0.05, **P < 0.01, ***P < 0.001).

