-
A, B
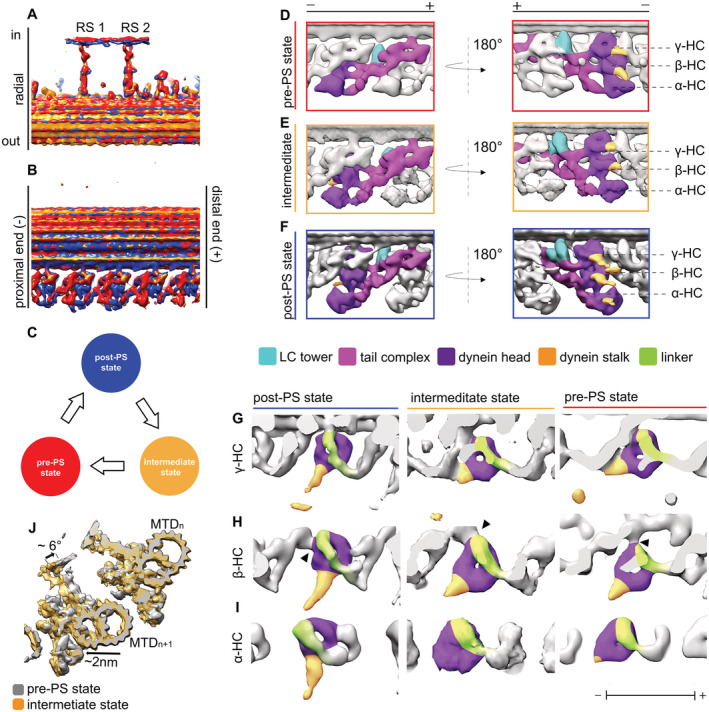
Overlay of the 96‐nm array of the three states (post‐PS, pre‐PS, and intermediate state). The structures are aligned based on the RS. With this, the DC3 (indicated by white arrowhead) are also aligned.
-
C
Model of the three states. The intermediate state is after the post and before the pre‐PS states.
-
D–F
The dynein heads move toward the proximal direction in the intermediate (E) and pre‐PS state (D) compared with the post‐PS state (F). Also the LC tower moves in the pre‐PS state compared with the post‐PS.
-
G–I
γ (G), β (H) and α (I) HC in the post‐PS, intermediate and pre‐PS conformation. Linker position for all the HC and states is indicated in green, while the stalk and the AAA ring are shown in yellow and purple, respectively. The black arrowhead in H indicates the interaction of the β‐dynein head to the proximally located IC2, which is consistent in all three states.
-
J
Overlay of the intermediate (orange) and pre‐PS (gray) map. Shown are two MTDs. The position of the adjacent B‐tubule changes between the two maps. In the intermediate conformation, the next MTD (“n + 1”) moves approximately 2‐nm away compared with the pre‐state (indicated by black arrow). Furthermore, the whole n + 1 MTD rotates by around 5°.

