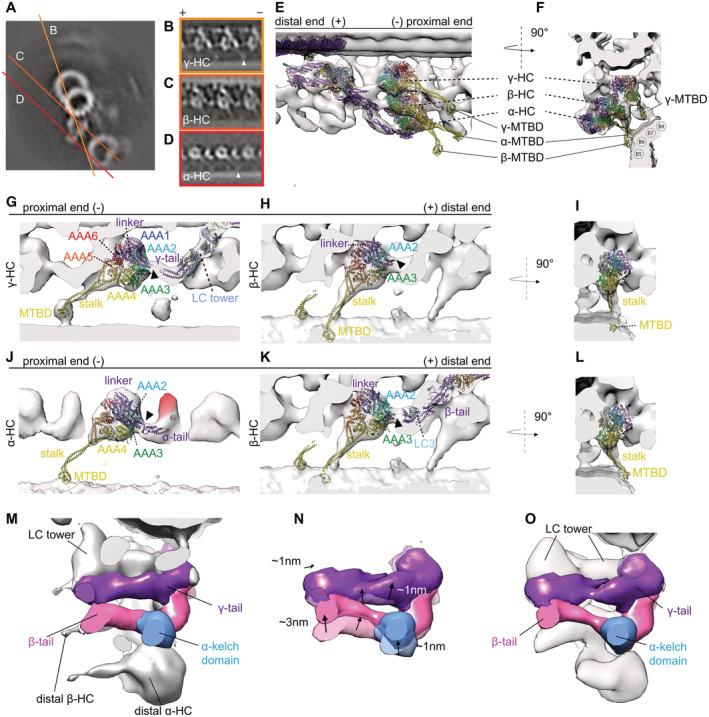
Enlarged view of individual dyneins in surface‐rendered representations with the pre‐PS model juxtaposed. The linker‐to‐tail connections are indicated by black arrowheads. The cytoplasmic pre‐PS dynein PDB‐4RH7 (Schmidt
et al,
2015) shows that the γ linker is in a bend conformation and that the MTBD is contacting the adjacent B‐tubule. The stalk is visible for the β‐dynein (C, H, I, K, L). If the stalk had an extended conformation like in the cytoplasmic PDB‐4RH7 conformation, the MTBD of the β‐HC would penetrate into the adjacent B‐tubule (H, I). This is due to the dynein head position, which is too close to the adjacent B‐tubule. The β stalk rather appears to be in a bend conformation which is much more similar to the conformation adapted in the Shulin–ODA complex (Mali
et al,
2021) (K and L). The head of the α‐Shulin–ODA (J) is in agreement to the tomographic map. The linker and the MTBD are located in tomographic density.