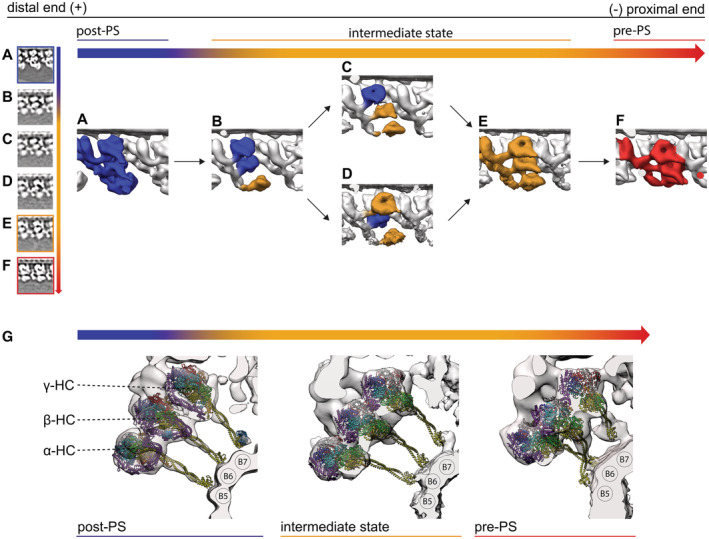
Figure 8. Recovery stroke of ODA.

-
A–FAll conformation of the ODA arranged in a proposed sequence during the recovery stroke. For all states, the ODA is shown in a tomographic cross section and as a surface‐rendered map. (A) Apo ODA in an all post‐PS conformation from the nucleotide‐free dataset. (B) The αHC moved to an intermediate state and appears blurred. (C) The β‐HC and αHC are in an intermediate conformation. (D) The γ and αHC are in an intermediate conformation. (E) All three HC are in an intermediate conformation. (F) All three dynein HC adopt the prepower stroke conformation.
-
GStalk orientation of the post‐PS, intermediate, and pre‐PS state. The tomographic maps suggest that in the post‐PS as well as the intermediate state the stalks are in a parallel, straight conformation. In the pre‐PS state, however, the map suggests that the stalks of the α‐ and β‐HC cross over.
