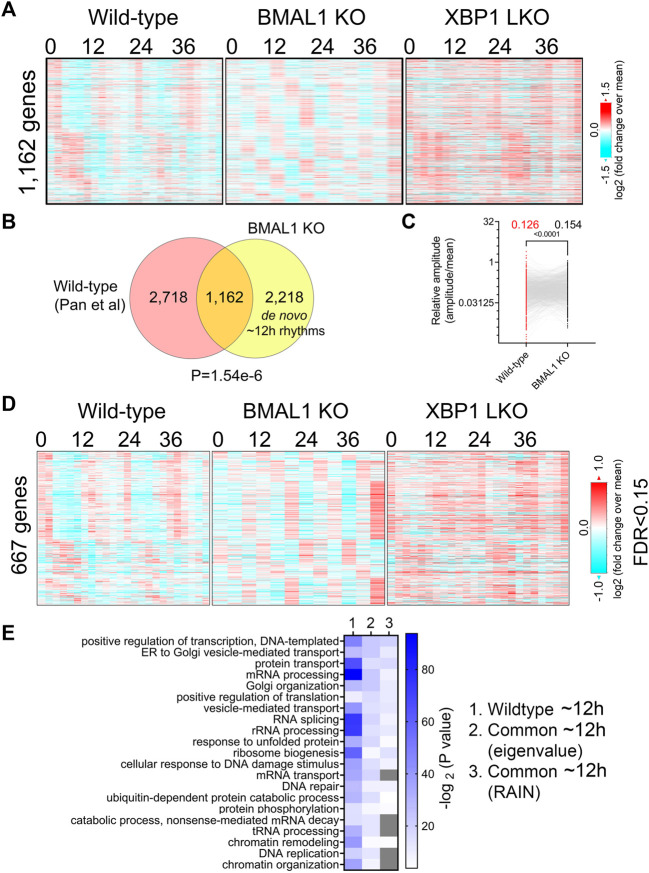
FIGURE 2.
Preservation of ∼12-h gene program and functionality between wild-type and BMAL1 knockout mice. (A) Heatmap of 1,162 commonly found ∼12-h rhythm gene expression in wild-type, BMAL1 knockout and XBP1 LKO mice. (B) Venn diagram comparing ∼12-h rhythm genes in wild-type and BMAL1 knockout mice. p-value is calculated by Chi-square test. (C) Relative amplitude of ∼12-h oscillations for 1,162 genes in wild-type and BMAL1 knockout mice. (D) Heatmap of 667 commonly found ∼12-h rhythm gene expression in wild-type, BMAL1 knockout and XBP1 LKO mice (FDR cut-off of 0.15). (E) GO analysis showing enriched biological pathways of ∼12-h genes found in wild-type or in both wild-type and BMAL1 knockout mice using all mice genes as background.

