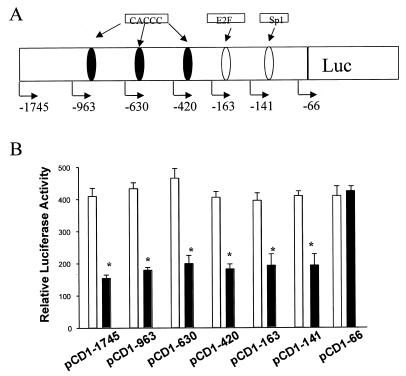
Figure 2.
Repression of CD1 promoter activity by GKLF. (A) Schematic representation of the CD1 promoter showing the location of the DNA sequences resembling Sp1 and E2F binding sites as well as multiple CACCC motifs. (B) Sense GKLF (black bar) or pCDNA-3 (open bar) expression vector was cotransfected with the pCD1-1745 Luc reporter or an equal amount of each of the other 5′ promoter constructs into L293 cells. pCMV-βgal (0.05 µg) was also cotransfected with each construct to correct for differences in transfection efficiency. Data are expressed as means ± S.E. of four separate experiments. *P < 0.05, compared to pCDNA-3-transfected cells in each individual construct.

