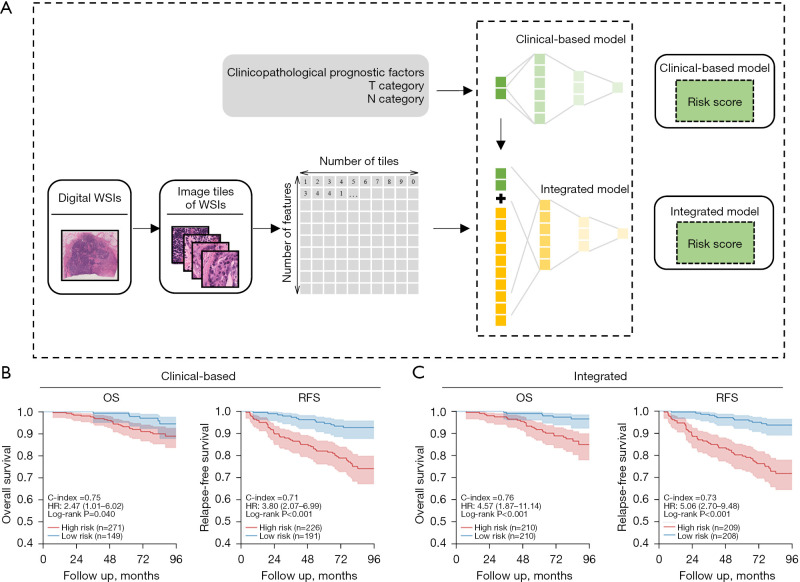
Figure 6.
Prediction of prognosis. (A) Schematic overview of prognostic prediction using two strategies. (B) Kaplan-Meier curves for high- and low-risk groups stratified by the clinical-based model. (C) Kaplan-Meier curves for high- and low-risk groups stratified by the integrated model. WSIs, whole slide images; OS, overall survival; RFS, relapse-free survival; C-index, concordance index; HR, hazard ratio.

