FIGURE 6.
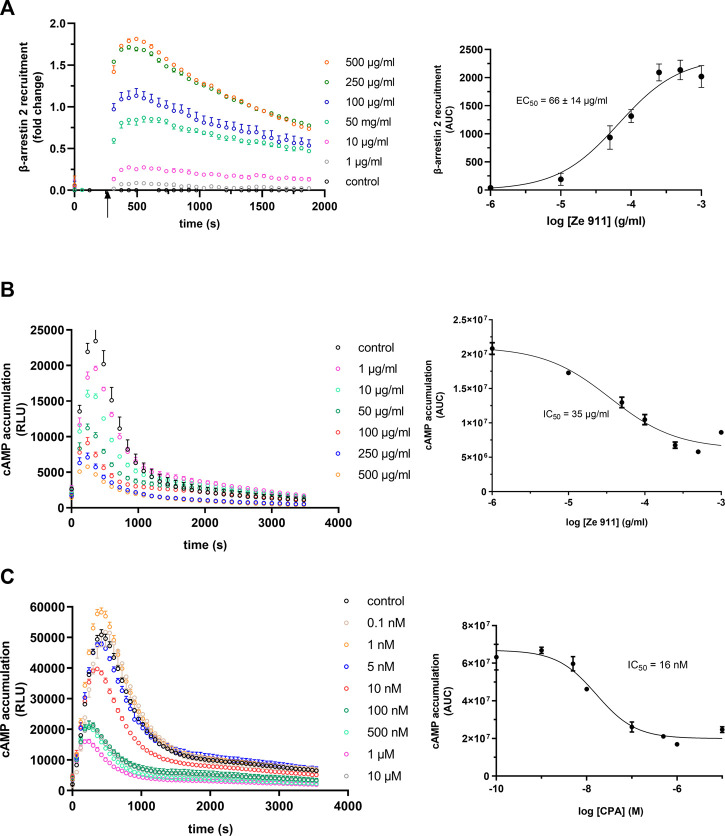
(A) Concentration dependency of β-arrestin 2 recruitment in the A1AR-NanoBit® reporter assay: At the time point indicated by the arrow, valerian extract Ze 911 was added to A1AR-NanoBit®-βarr2 HEK 293 cells at the concentrations indicated beside the graph, and luminescence was measured for 30 min. A solvent control of 0.1% DMSO was included. The graph on the left is exemplary for one of three experiments performed in triplicate. The dose–response curve on the right was calculated from all three experiments using areas under the curves (AUCs). Values are given as mean ± SEM (n = 3 independent experiments performed in triplicate). Concentration dependency of Gi activation measured by the inhibition of cAMP production in the GloSensor™ reporter assay for (B) valerian extract Ze 911 and (C) CPA: HEK GloSensor™ cells were incubated with concentrations indicated, cAMP accumulation was stimulated with 1 µM isoprenaline +1 µM forskolin (timepoint 0), and luminescence was recorded for 60 min. A solvent control of 0.1% DMSO was included. Right: dose–response curves calculated using the area under the curves (AUCs). Values (mean ± SEM) of three wells from one exemplary experiment are shown. Experiments were repeated twice with similar results (see also Supplementary Figure S4A).

