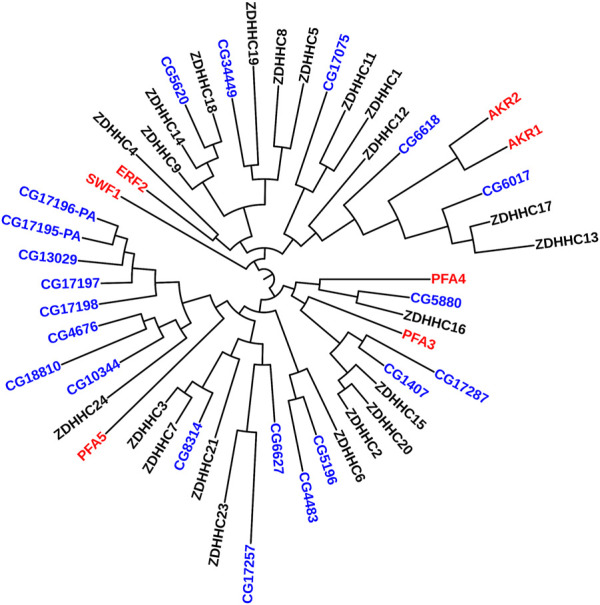
FIGURE 2.

Phylogenetic Tree comparing PATs in yeast, flies, and humans. Maximum Likelihood midpoint-rooted phylogenetic tree of full-length ZDHHC proteins from Saccharomyces cerevisiae (red), Drosophila melanogaster (blue), and Homo sapiens (black) generated in Mega 11 software with 100 bootstrap replication and Jones-Taylor-Thornton model for amino acid substitution model (Tamura et al., 2021). The Drosophila PATs that cluster together (CG17196-PA--CG10344) are expressed only in fly testes.
