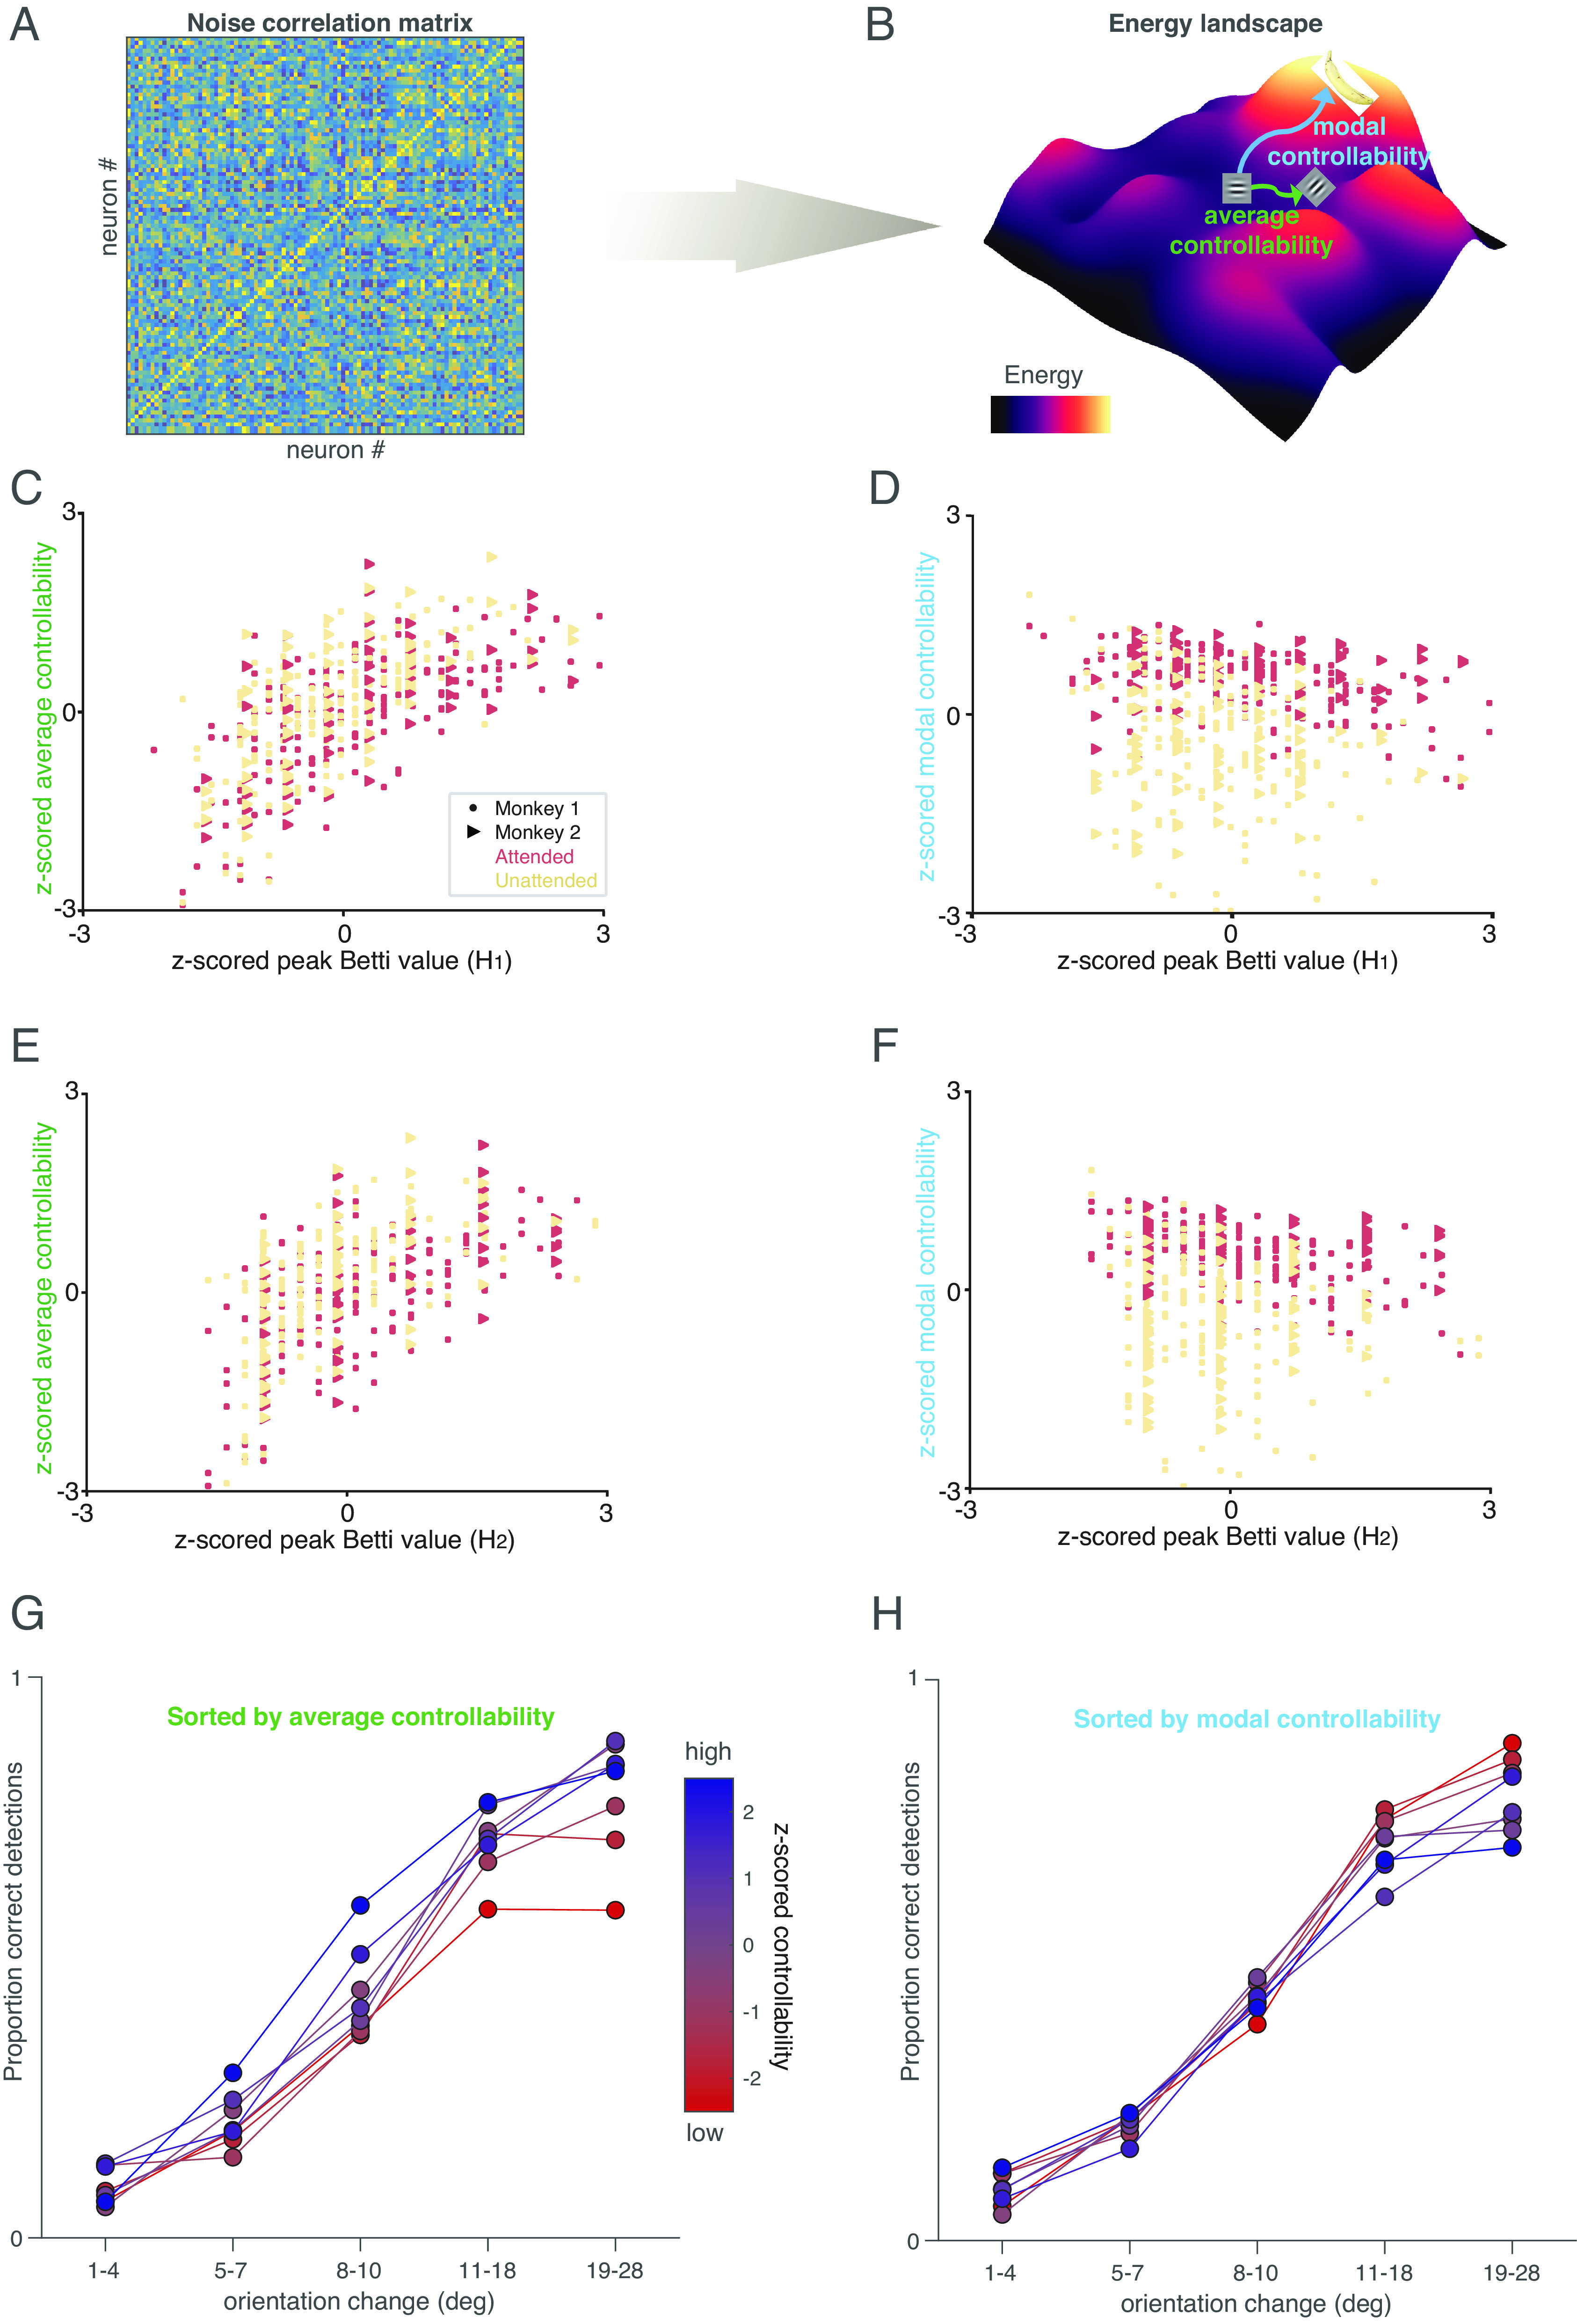
Fig. 4.

TDA and controllability provide insight into network function. (A and B) Illustration of our controllability calculation. We consider the noise correlation matrix (A) as a functional connectivity matrix, and use this to calculate an energy landscape (illustrated for a hypothetical situation in B; colors indicate energy). Average controllability is defined as the energy required to move from a starting point (e.g., a response to a horizontal Gabor stimulus) to nearby states (e.g., a response to an oblique Gabor), and modal controllability is defined as the energy required to move to distant states (e.g., thinking about a banana). (C) High-average controllability is associated with maximum number of circular (i.e., 1st dimension) features. Both measures were z-scored for each animal, and the lines were fit for each attention condition; attended: r = 0.65, P = 1.03e − 31; unattended: r = 0.68, P = 1.28e − 33; paired t-test (attended and unattended, average controllability): P = 7.5e − 61. (D) High modal controllability is associated with lower number of circular (i.e., 1st dimension) features (Conventions as in A; (attended: r = −0.37, P = 7.7e − 10; unattended: r = −0.23, P = 3.2e − 4; paired t-test (attended and unattended, modal controllability): P = 1.5e − 38). (E) Relationship between average controllability and maximum number of spherical features (i.e., 2nd dimension) (attended: r = 0.59, P = 3.5e − 25; unattended: r = 0.59, P = 9.5e − 24). Conventions as in (C). (F). Relationship between modal controllability and number of spherical (2nd dimension) features (attended: r = −0.38, P = 3.12e − 10; unattended: r = −0.18, P = 4.7e − 3). Conventions as in (D). (G) High-average controllability is associated with better performance at all orientation change amounts. Colors represent z-scored average controllability (the experimental sessions were split into six equally sized bins by average controllability), and the plot shows proportion correct detections (hit rate) as a function of orientation change amount. (H) High modal controllability (bluer colors) is associated with a worse lapse rate (worse performance on easier trials). Conventions as in (H).
