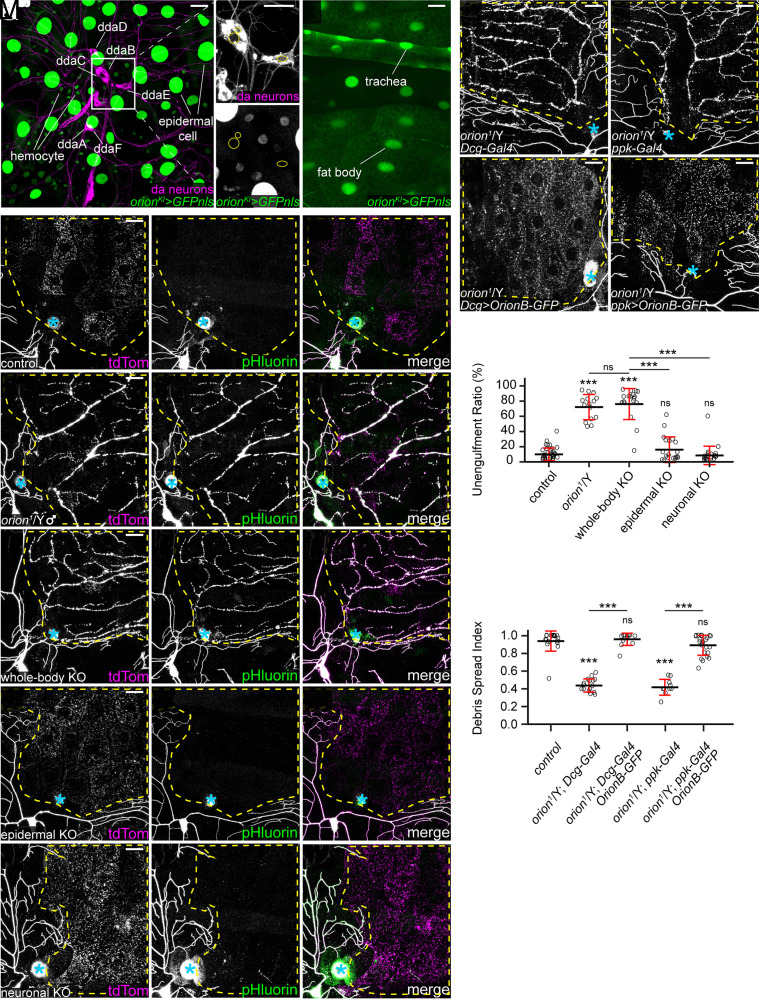
Fig. 2.
Orion functions cell-non-autonomously. (A and B) GFPnls expression driven by orion-LexA (orionKI) in epidermal cells, hemocytes (A), trachea, and fat body (B), but not in da neurons (A, Insets). Yellow circles indicate nuclei of ddaB, ddaC, and ddaE neurons (A). [Scale bars, 25 μm (A), 10 μm (A Insets), and 50 μm (B).] (C–G”) Partial dendritic fields of neurons in control (C–C”, same images as Fig. 1 A–A”), orion1 hemizygotes (D–D”, same images as Fig. 1 B–B” for clarity), whole-body orion KO (E–E”), epidermal orion KO (F–F”), and neuronal orion KO (G–G”) at 22 to 24 h AI. (H–K) Partial dendritic fields of ddaC neurons in orion1 hemizygotes with fat body Gal4 (H), with OrionB-GFP OE in the fat body (I), with neuron Gal4 (J), and with OrionB-GFP OE in neurons (K) at 22 to 24 h AI. (L) Quantification of unengulfment ratio of injured dendrites. n = number of neurons and N = number of animals: control and orion1/Y (same dataset as in Fig. 1D); whole-body orion KO (n = 18, N = 10); epidermal orion KO (n = 19, N = 11); neuronal orion KO (n = 21, N = 11). One-way ANOVA and Tukey’s test. (M) Quantification of debris spread index of injured dendrites (area ratio of all 15 pixel × 15 pixel squares that contained dendrite debris in the region of interest). n = number of neurons and N = number of animals: orion1/Y (n = 18, N = 10); Dcg-Gal4 in orion1/Y (n = 16, N = 9); Dcg>OrionB-GFP in orion1/Y (n = 13, N = 7); ppk-Gal4 in orion1/Y (n = 10, N = 6); ppk>OrionB-GFP in orion1/Y (n = 24, N = 12). One-way ANOVA and Tukey’s test. Neurons were labeled by 21-7>UAS-CD4-tdTom (A and B), ppk-MApHS (C–G”), ppk-CD4-tdTom (H and I), and ppk>CD4-tdTom (J and K). In (C–K), yellow dash outlines: territories originally covered by injured dendrites; blue asterisks: injury sites; (scale bars, 25 μm.) For all quantifications, ***P ≤ 0.001; n.s., not significant. The significance level above each genotype is for comparison with the control. Black bar, mean; red bar, SD. See also SI Appendix, Fig. S2.

