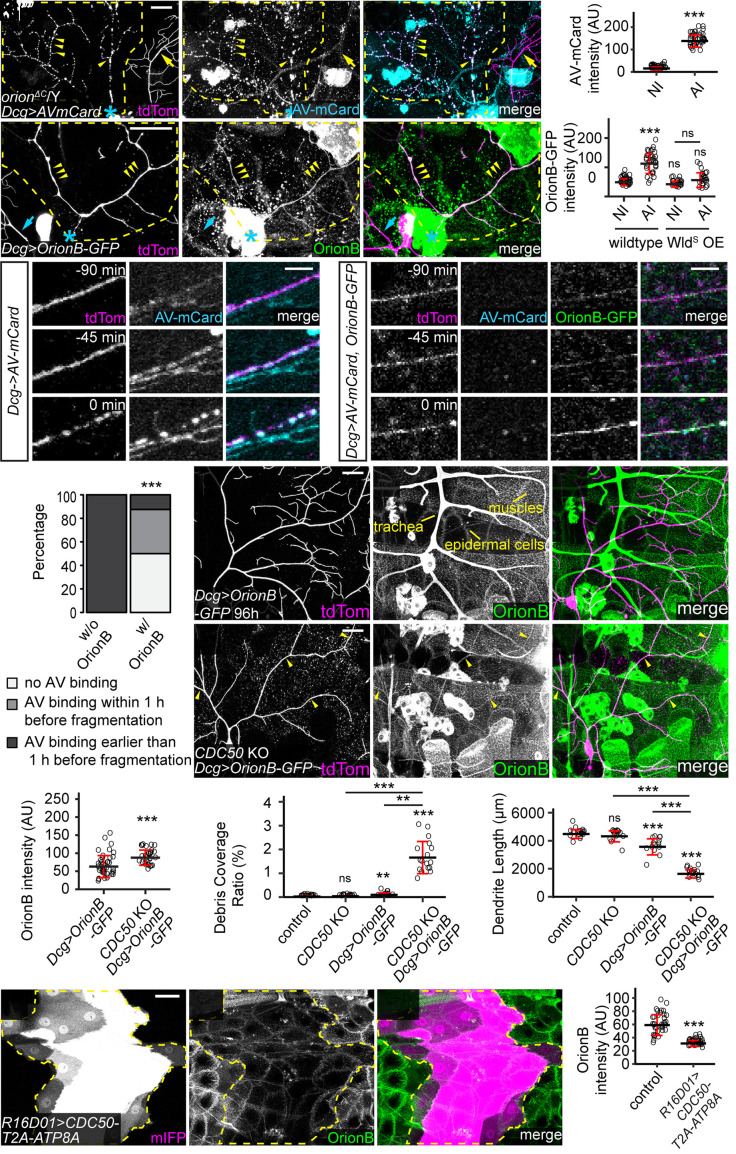
Fig. 3.
PS exposure induces Orion binding to the cell surface. (A–A”) Labeling of injured dendrites of a ddaC neuron by AV-mCard at 23 h AI in orionΔC hemizygous larvae. Yellow arrowheads: injured dendrites with AV-mCard labeling; yellow arrows: uninjured dendrites lacking AV-mCard labeling. (B) Quantification of AV-mCard binding on dendrites. AV-mCard intensities were measured on both uninjured (NI) and injured (AI) dendrites. n = number of measurements and N = number of animals: NI (n = 39, N = 8); AI (n = 39, N = 8). Welch’s t test. (C–C”) Labeling of injured dendrites of a ddaC neuron by Orion-GFP at 6 h AI in wild-type larvae. Yellow arrowheads: injured dendrites with OrionB-GFP labeling. (D) Quantification of Orion-GFP binding on dendrites of wild-type and WldS OE neurons. n = number of measurements and N = number of animals: wild-type NI (n = 39, N = 10); wild-type AI (n = 36, N = 10); WldS OE NI (n = 22, N = 6); WldS OE AI (n = 23, N = 6). Kruskal–Wallis (one-way ANOVA on ranks) and Dunn’s test, P-values adjusted with the Benjamini–Hochberg method. (E and F) Time series of injured dendrites of ddaC neurons from 90 min before fragmentation to the moment of fragmentation, with only AV-mCard expressed (E) or both OrionB-GFP and AV-mCard coexpressed (F) by the fat body. Time stamps are relative to the frame of dendrite fragmentation. (G) Percentages of injured dendrites showing no AV binding, AV binding within 1 h before fragmentation, AV binding earlier than 1 h before fragmentation. n = number of measurements and N = number of animals: w/o OrionB OE (n = 9, N = 5); w/ OrionB OE (n = 8, N = 3). Fisher’s exact test. (H–I”) Distribution of fat body–derived OrionB-GFP with wild-type (H–H”) and CDC50 KO (I–I”) dendrites at 96 h AEL. Peripheral tissues showing OrionB binding are labeled in (H’). Yellow arrowheads indicate OrionB binding on CDC50 KO dendrites (I–I”). (J) Quantification of OrionB-GFP binding on wild-type and CDC50 KO dendrites. n = number of measurements: Dcg>OrionB-GFP (n = 41, N = 7); CDC50 KO + Dcg>OrionB-GFP (n = 29, N = 6). Welch’s t-test. (K and L) Quantification of debris coverage ratio (K) and dendrite length (L) at 96 h AEL. n = number of neurons and N = number of animals: control (n = 17, N = 9); CDC50 KO (n = 15, N = 8); Dcg>OrionB-GFP (n = 13, N = 8); CDC50 KO + Dcg>OrionB-GFP (n = 17, N = 9). For (K), Kruskal–Wallis (one-way ANOVA on ranks) and Dunn’s test, P-values adjusted with the Benjamini–Hochberg method; for (L), one-way ANOVA and Tukey’s test. (M–M”) OrionB-GFP binding on epidermal cells that expressed CDC50-T2A-ATP8A. Yellow dash outlines: CDC50-T2A-ATP8A overexpressing region. (N) Quantification of OrionB-GFP binding on wild-type epidermal cells and CDC50-T2A-ATP8A OE epidermal cells. n = number of measurements and N = number of animals: control (n = 36, N = 9); R16D01>CDC50-T2A-ATP8A (n = 36, N = 9). Welch’s t test. In (A–A”) and (C–C”), yellow dash outlines: territories originally covered by injured dendrites; blue asterisks: injury sites. Neurons were labeled by ppk-MApHS (A–A” and E–E”) and ppk-CD4-tdTom (C–C”, F–F”, and H–I”). [Scale bars, 25 μm (A–A”, C–C”, and H–I”), 5 μm (E and F), and 50 μm (M–M”).] For all quantifications, **P ≤ 0.01, ***P ≤ 0.001; n.s., not significant. The significance level above each genotype is for comparison with the control. Black bar, mean; red bar, SD. See also Movies S1–S3 and SI Appendix, Fig. S3.

