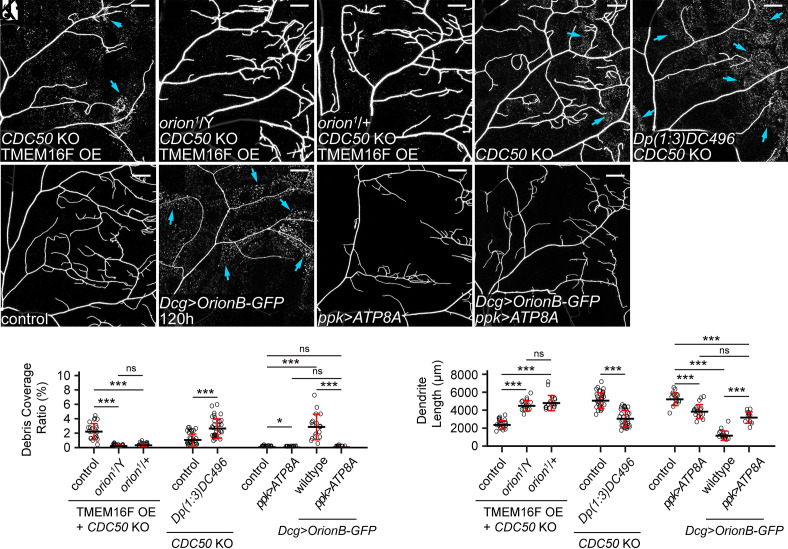
Fig. 6.
The Orion dosage determines the sensitivity of epidermal cells to PS-exposing dendrites. (A–C) Partial dendritic fields of a TMEM16F OE + CDC50 KO ddaC neuron in the WT background (A, same image as Fig. 1E), in the orion1 hemizygous background (B, same image as Fig. 1F), and in the orion1 heterozygous background (C). (D and E) Partial dendritic fields of CDC50 KO neurons in the control (D) and Dp(1;3)DC496 (E) at 120 h AEL. Blue arrows: debris shed from dendrites. (F–I) Partial dendritic fields of ddaC neurons in the control (F), with fat body–derived OrionB-GFP (G), with ATP8A OE in the neuron (H), and with fat body–derived OrionB-GFP and ATP8A OE in the neuron (I) at 120 h AEL. (J and K) Quantification of debris coverage ratio (J) and dendrite length (K). n = number of neurons and N = number of animals: for TMEM16F OE + CDC50 KO, control and orion1/Y (same dataset as in Fig. 1G), orion1/+ (n = 18, N = 9); for (J), Kruskal–Wallis (one-way ANOVA on ranks) and Dunn’s test, P-values adjusted with the Benjamini–Hochberg method; for (K), one-way ANOVA and Tukey’s test. For CDC50 KO, control (n = 33, N = 17), Dp(1;3)DC496 (n = 33, N = 17), Welch’s t test. For effects of Dcg>OrionB-GFP and ppk>ATP8A at 120 h AEL, control (n = 17, N = 9), ppk>ATP8A (n = 17, N = 9), Dcg>OrionB-GFP (n = 17, N = 9), ppk>ATP8A + Dcg>OrionB-GFP (n = 12, N = 7); for (J), Kruskal–Wallis (one-way ANOVA on ranks) and Dunn’s test, P-values adjusted with the Benjamini–Hochberg method; for (K), one-way ANOVA and Tukey’s test. Neurons were labeled by ppk-MApHS (A–C and H), ppk-CD4-tdTom (D–G), and ppk-Gal4>CD4-tdTom (I). For all image panels, (scale bars, 25 μm.) For all quantifications, *P ≤ 0.05, ***P ≤ 0.001; n.s., not significant. The significance level above each genotype is for comparison with the control. Black bar, mean; red bars, SD. See also SI Appendix, Fig. S6.

