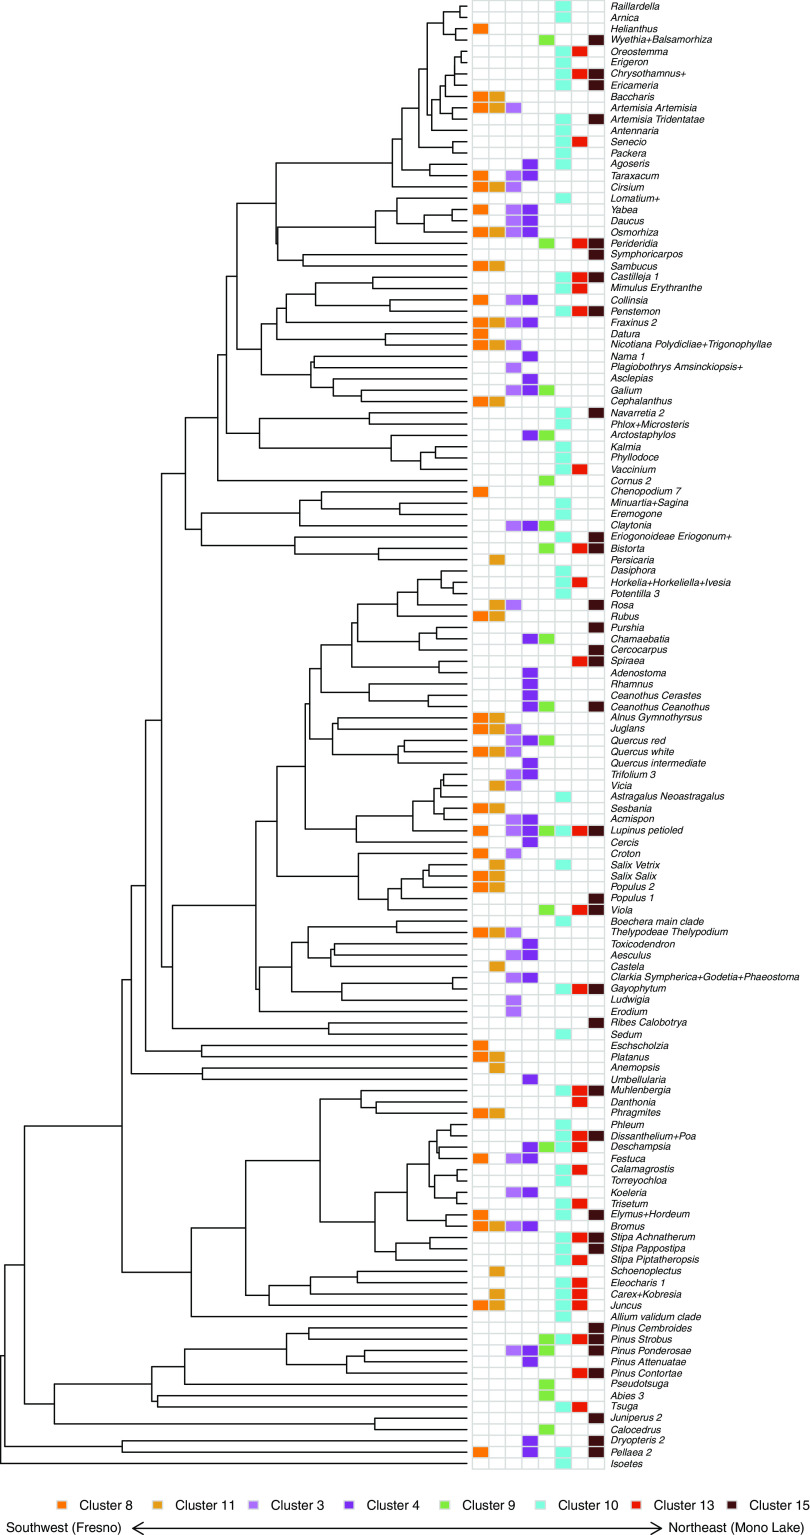
Fig. 2.
Indicator species analysis for the spectral clusters in SI Appendix, Fig. S2, sorted from West to East and by phylogenetic relatedness. This phylogeny represents the 129 OTUs that comprise over 95% of the relative abundance in the community survey data. Community similarity between the neighboring clusters is apparent, especially in Spectral Cluster 8 and 11, 3, and 4 as well as similarity in 13 and 15. From West to East, expected patterns of turnover are apparent (especially for canopy species) as the occurrence of broadleaf species peaks in Spectral Cluster 4 and then shifts toward Gymnosperms in 10, 13, and 15.

