Figure 3.
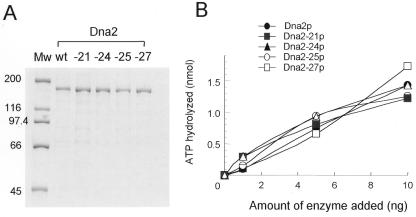
Analyses of mutant Dna2 proteins by SDS–PAGE and comparison of their ATPase activities. (A) Coomassie blue staining of a protein gel containing Dna2-wt, Dna2-21, Dna2-24, Dna2-25 and Dna2-27 proteins resolved by 8% SDS–PAGE. Each lane was loaded with ∼1 µg of the proteins, based on the value obtained in the Bradford assay (Bio-Rad). Mw indicates molecular size marker and the numbers to the left of the figure denote molecular weights (kDa). (B) Single-stranded DNA-dependent ATPase activities of mutant Dna2 enzymes were measured. The reactions, as described previously (16), were carried out in the presence of 1, 5 and 10 ng of proteins. The symbols for each mutant protein are as indicated in the figure. The amount of ATP hydrolyzed was measured as described previously (16).

