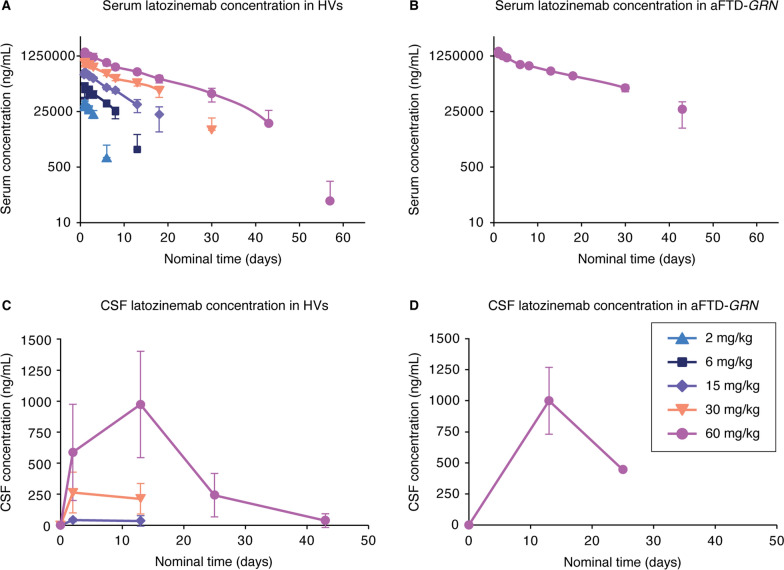
Fig. 4.
Pharmacokinetics of latozinemab in HVs and aFTD-GRN participants. A–B Mean ± SD serum concentrations of latozinemab plotted as a function of time for HVs in the SAD groups A and aFTD-GRN participants who received the 60-mg/kg dose B. For the HV SAD groups A, n = 4–13 participants/group/timepoint, and for the aFTD-GRN group B, n = 8 at all timepoints, except for days 15 (n = 7 at 4 h post dose), 85 (n = 4), and 141 (n = 3). C–D Mean ± SD CSF concentrations of latozinemab plotted as a function of time for HVs in the SAD groups C and aFTD-GRN participants D; note that CSF samples were not collected for HVs in the 2-mg/kg and 6-mg/kg dose groups. For the HV SAD groups C, n = 6 participants/group/timepoint, except for the 60-mg/kg dose group prior to dosing (n = 13) and on day 13 (n = 5). For the aFTD-GRN group D, n = 5 at all timepoints, except for day 25 (n = 1). Nominal time after dose is relative to the end of infusion. Placebo-treated subjects were excluded from the PK population. aFTD-GRN, asymptomatic carrier of GRN mutations causative of frontotemporal dementia; CSF, cerebrospinal fluid; HV, healthy volunteer

