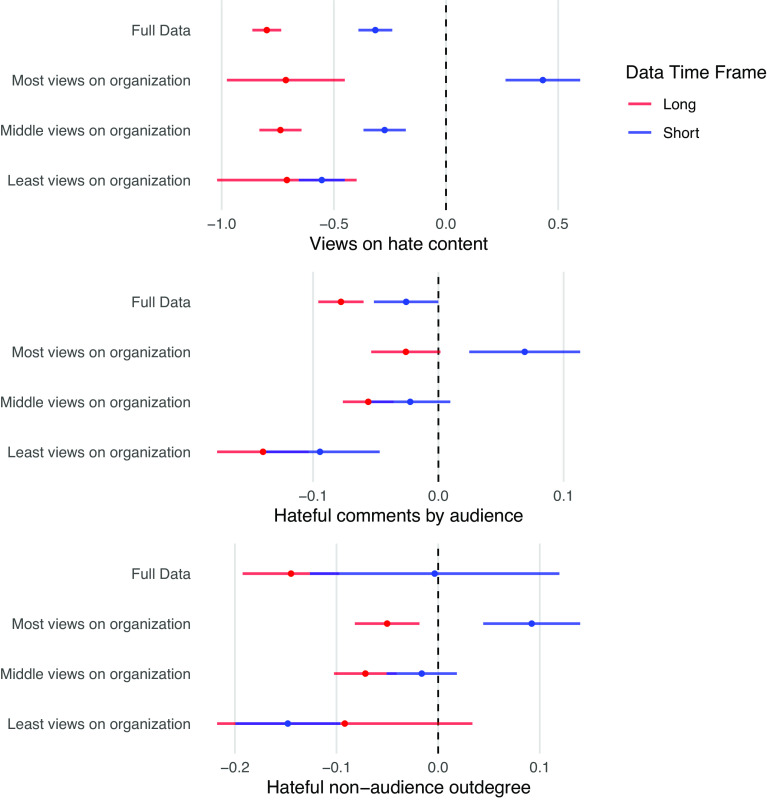
Fig. 5.
Effect of disruptions on backlash outcomes in the short and longer-term. Points represent the estimates for each model. Lines represent 95% confidence intervals. Beneath each plot is the outcome variable. The samples are defined by predisruption views of organization content, with “Most views on organization” representing the sample that viewed the most content and “Least views on organization” representing the sample that viewed the least content. While the subgroup closest to the organization increased its consumption and production of hateful content in the short term, this effect becomes negative in the longer-term. Moreover, the effect on hateful nonaudience outdegree becomes negative.

