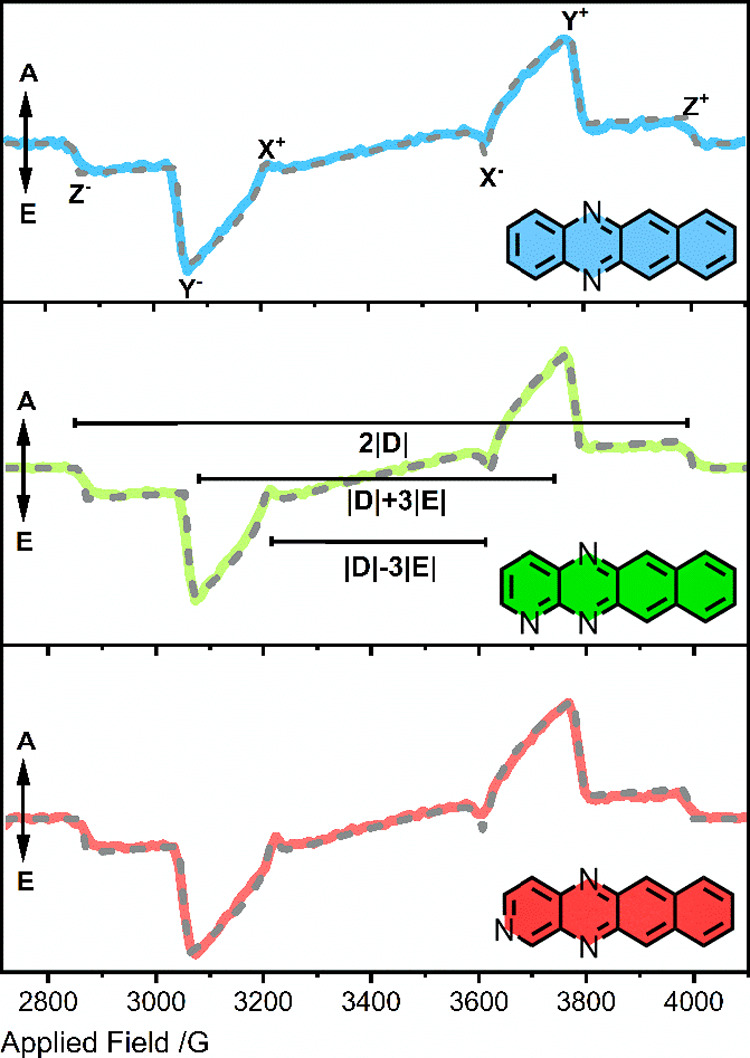
Figure 3.

X-band photoexcited trEPR spectra for DAT:1-TNB (blue), TrAT1:1-TNB (green), and TrAT2:1-TNB (red). Traces are taken 400 ns after laser flash, with samples made to a concentration of 0.1% mol/mol and illuminated with 5–8 ns pulses of 532 nm light measured at 7 mJ/pulse. Gray dashed lines represent fittings performed using the EasySpin toolbox (see the SI for details).
