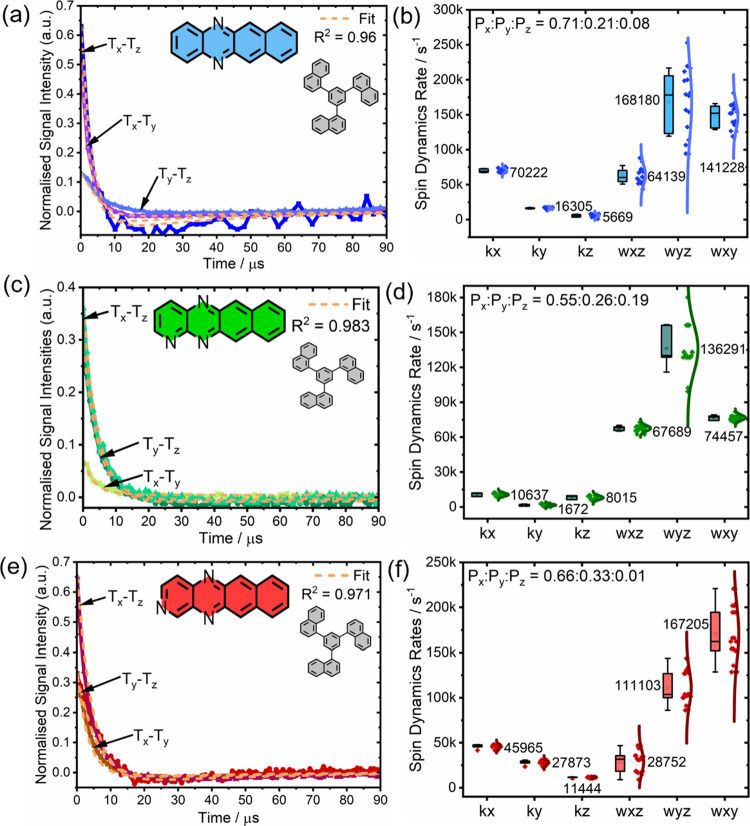
Figure 4.
(a–c) ZF trEPR spectra of DAT:1-TNB (blue), TrAT1:1-TNB (green), and TrAT2:1-TNB (red); (d–f) transition-specific spin–lattice relaxation (ωij) and sublevel-selective triplet decay rates (κi) determined by fitting of ZF trEPR signals. Sample concentrations were 0.1% mol/mol and illuminated with 5–8 ns pulses of 510 or 532 nm light at 1 mJ/pulse. Individual signals were obtained at room temperature and averaged 512 times. Spin dynamics fittings are shown as orange dash lines.

