FIG 2.
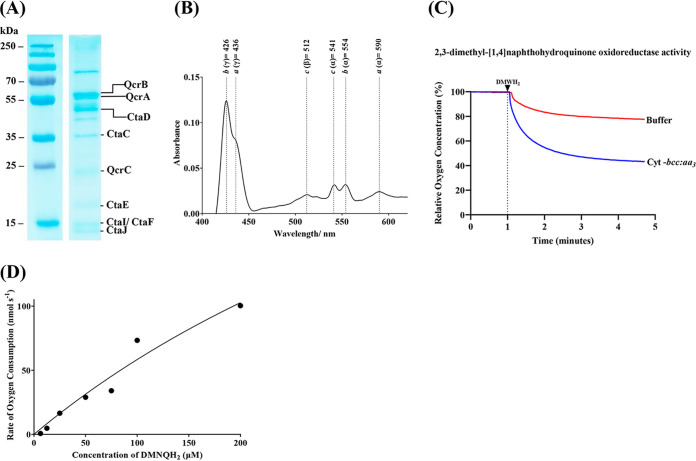
Characterization of purified M. tuberculosis cyt-bcc:aa3. (A) 12% SDS gel profile of purified supercomplex. The bands for QcrB, QcrA, and QcrC were further confirmed through matrix-assisted laser desorption/ionization-time of flight (MALDI-TOF) mass spectrometry (MS) (see (Table S1A to C in the supplemental material). (B) Difference spectrum of purified M. tuberculosis cyt-bcc:aa3 after reduction with Na2S2O4. The spectrum registered peaks for heme a (437 nm, 592 nm), heme b (424 nm, 555 nm), and heme c (512 nm, 543 nm). (C) Characterization of the purified enzyme in an oxygen consumption assay. In the presence of 2,3-dimethyl[1,4]naphthohydroquinone, the purified supercomplex reduced oxygen levels significantly, as shown by the profile after subtracting background activity. (D) Enzyme kinetics of M. tuberculosis cyt-bcc:aa3. A dose response of 2,3-dimethyl[1,4]naphthohydroquinone was used to determine the Km, kcat, and kcat/Km values of the enzyme.

